Is your return on ad spend where it should be? Digital advertising has become more competitive than ever, and knowing whether you have a good ROAS can make the difference between profitable growth and wasted budget.
A good ROAS isn’t one-size-fits-all. It varies based on your industry, profit margins, and business model. That’s why comparing your performance against ROAS benchmarks by industry is essential. Whether you’re spending $1,000 or $100,000 monthly on Google Ads or Meta campaigns, understanding your ROAS percentage tells you exactly how much revenue each dollar of advertising investment generates.
In this article, you’ll discover current ROAS averages across major industries, learn what targets make sense for your specific sector, and get actionable strategies to maximize ROAS. From smarter audience targeting to landing page optimization and strategic budget allocation, we’ll show you practical ways to boost ROAS and turn your digital advertising campaigns into reliable profit drivers.

What is a Good ROAS?
A good ROAS typically ranges from 2:1 to 4:1 (200%–400%), according to WebFX. This means you earn $2 to $4 in revenue for every $1 spent on advertising. Higher ROAS indicates more efficient ad spend and better campaign performance.
ROAS varies by industry, profit margins, and customer lifetime value. For example, e-commerce brands with high margins may require a higher ROAS to remain profitable, while SaaS companies may accept a lower ROAS because subscription revenue is long-term.
There is no fixed ROAS that works for every business – effective ROAS depends on financial structure, strategy, and how success is measured. To evaluate whether your ROAS is meeting expectations, you first need to understand how it’s calculated.
How to Correctly Calculate ROAS (Return on Ad Spend)?
To calculate ROAS, divide the total revenue generated from an ad campaign by the total cost of that campaign. The basic formula is:
For example, if a campaign generates $8,000 in revenue and costs $2,000, the ROAS is 4:1 (or 400%). This means every $1 spent on ads returns $4 in revenue.
When calculating ROAS, include all advertising-related expenses – not just media spend. This means factoring in costs such as bid management tools, ad platform fees, and landing page development. ROAS only reflects revenue directly linked to advertising, excluding other sales or indirect conversions. Unlike ROI, which considers total return across all business activities, ROAS focuses purely on ad performance.
While this formula shows how efficient your ad spend is, it doesn’t indicate whether your campaigns are profitable. To assess that, you need to calculate your break-even ROAS and set a target ROAS based on your profit goals.
Break-even ROAS calculation
To understand what ROAS is good, calculate your break-even ROAS – the minimum return needed to cover your advertising costs without incurring losses. The formula is:
Profit margin is calculated by dividing net profit by revenue, then multiplying by 100 to express it as a percentage:
Profit Margin = (Revenue – Costs) ÷ Revenue × 100
For example, if you sell a product for $100, and your total cost (product, packaging, shipping) is $75, your net profit is $25. That gives you a 25% (0.25) profit margin, which means your break-even ROAS is 4.0 – you must generate $4 in revenue for every $1 spent on ads just to cover costs.
In another case, a digital product priced at $100, with delivery costs of only $20, yields an 80% (0.8) profit margin. Here, the break-even ROAS is 1.25, so even a relatively low-performing ad can be profitable.
Target ROAS calculation
While break-even ROAS tells you the minimum to avoid losses, your target ROAS defines the performance needed to meet specific profit goals. During the testing phase, a safe starting point is to aim for 1.5× your break-even ROAS to offset inefficiencies and data gaps. Once the campaign proves effective, the target should increase to 2–3× the break-even ROAS to maintain profitability while scaling.
For example, if your digital product has an 80% profit margin, the break-even ROAS is 1.25. During testing, your target ROAS should be 1.87 (1.25 × 1.5). As you scale, the target should rise to 2.5–3.75, ensuring that increased ad spend still produces healthy profit margins. Setting clear ROAS targets helps control budget efficiency and align campaigns with business objectives.
Your ads deserve better ROAS—build pages that convert with Landingi.
How to Properly Attribute Every Dollar of Ad Revenue?
To properly attribute every dollar of ad revenue, you need to connect each conversion to the specific advertising campaign or channel that influenced it. This requires using the right attribution model – such as last-click, first-click, linear, or data-driven – and setting up accurate conversion tracking across all platforms involved in your advertising efforts.
Start by implementing clean and consistent UTM parameters on all paid links, which allows analytics tools to trace user journeys. Use tracking solutions like Google Analytics 4, Meta Conversion API, or third-party platforms such as Hyros or Triple Whale to link ad interactions with revenue across devices and sessions.
To ensure reliable attribution:
- Track all touchpoints using properly tagged URLs,
- Sync ad platforms with analytics tools,
- Use server-side tracking for higher accuracy,
- Select an attribution model that aligns with your sales cycle.
Accurate attribution ensures you evaluate ROAS by campaign, platform, and funnel stage. Without it, performance metrics are skewed, and budget decisions risk being based on incomplete or misleading data.
Average ROAS Statistics by Industry
Industry-specific ROAS benchmarks can help you set realistic performance goals and identify which platforms deliver the best return. The table below compares median ROAS by industry across Google Ads and Meta Ads (Facebook & Instagram) in 2025, based on data from Varos.
| Industry | Median Google Ads ROAS | Median Meta Ads ROAS |
|---|---|---|
| Toys | 6.07 | 2.69 |
| Sports & Fitness | 4.35 | 2.41 |
| Books | 4.31 | 0.98 |
| Baby | 4.00 | 4.39 |
| Fashion | 4.07 | 2.65 |
| Home & Garden | 3.90 | 2.60 |
| Electronics | 3.76 | 2.95 |
| Beauty | 3.57 | 1.57 |
| Entertainment | 3.52 | 3.27 |
| Food & Beverages | 3.45 | 1.67 |
| Education | 2.58 | 1.54 |
| Healthcare | 2.24 | 1.20 |
Key insights:
- Toys and Sports & Fitness report the highest ROAS on Google Ads, with scores of 6.07 and 4.35, confirming that intent-driven channels deliver stronger results for these categories.
- Baby is the only industry where Meta Ads outperform Google, with a ROAS of 4.39 compared to 4.00, indicating the high effectiveness of visual content and interest-based targeting.
- Healthcare ranks lowest across both platforms, with ROAS at 2.24 on Google and 1.20 on Meta, reflecting higher customer acquisition costs or reduced targeting efficiency.
These benchmarks confirm that ROAS depends heavily on both industry and platform, and that success on one channel does not guarantee equal results on another. Using industry-specific ROAS data enables more accurate forecasting, better budget allocation, and smarter advertising strategy decisions.
Know your ROAS benchmarks? Now improve them with high-converting landing pages!
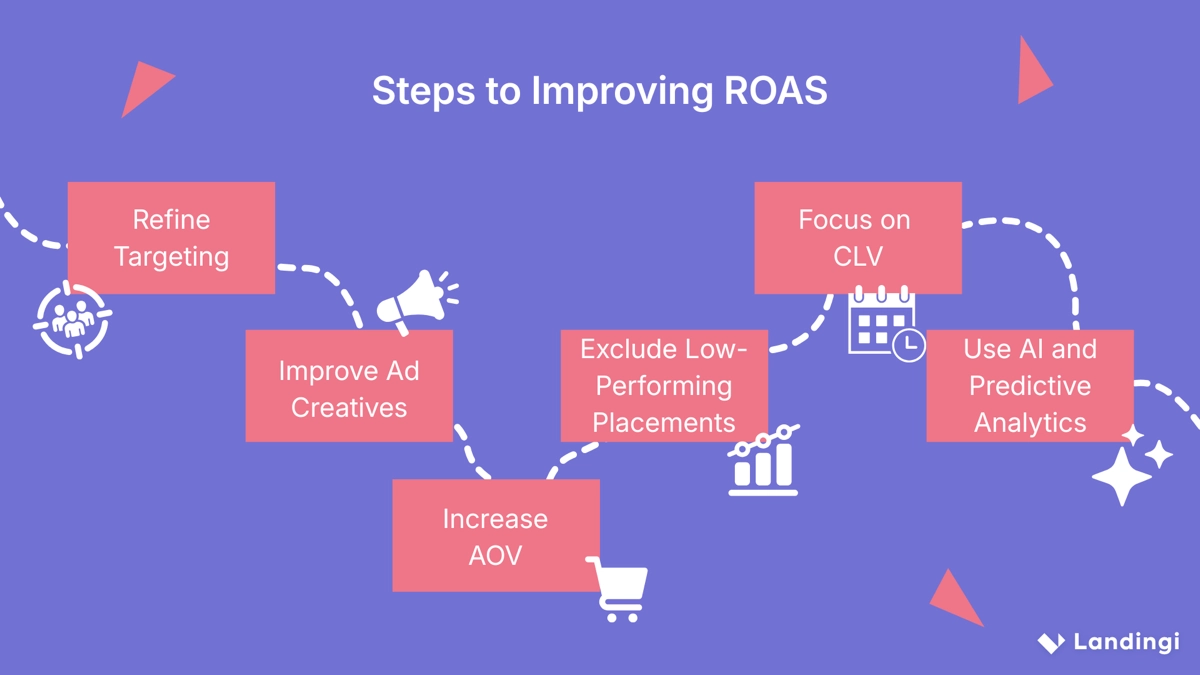
7 Steps to Improving ROAS
Improving ROAS requires optimizing targeting, creatives, funnels, and landing pages. The goal is to generate more revenue per click while controlling or reducing ad spend. Each improvement step should directly impact either conversion rate or cost efficiency.
1. Refine targeting
Focus your ads on a clearly defined target audience using demographic, interest-based, and behavioral data. Use the tools within each advertising platform – such as lookalike audiences, custom segments, or retargeting lists – to reach users with the highest likelihood of conversion, thereby reducing wasted ad spend and enhancing ROAS efficiency.
2. Improve ad creatives
Adapt ad formats to each advertising platform – video consistently outperforms static images, while carousels and Stories generate stronger engagement in visual-first environments. The most effective way to improve ad creatives is to test messaging and visuals to determine what drives higher engagement and conversions.
To understand what actually drives performance, test one variable at a time:
- Messaging angle (benefit vs. pain point)
- Visual style (UGC, product demo, lifestyle)
- Hook (question, bold claim, social proof)
Keep everything else constant so results are meaningful.
Creative fatigue is real – especially on social platforms. Rotate variations every 1–2 weeks for high-spend campaigns to maintain engagement and control CPMs.
Creative quality directly influences click-through rate and cost per click, which affect ROAS across all marketing campaigns. According to RedTrack, the difference between high-performing and average ad creatives can result in a 2–3 times improvement in ROAS, even when targeting and bidding remain identical.
3. Optimize landing pages
Focus first on message match and clarity above the fold. Your landing page should immediately reflect the ad’s promise – same headline logic, same offer, same visual cues – so users feel they’re in the right place. Clearly communicate the core benefit within seconds and present one primary CTA. Remove navigation, secondary offers, and any elements that distract from conversion.
Next, reduce friction and build trust at the decision point. Optimize for mobile speed and simplicity, shorten forms or checkout flows, and use outcome-driven CTA copy. Reinforce credibility near the CTA with concise social proof (testimonials, logos, numbers). Use A/B testing to validate improvements by testing one change at a time (e.g., headline, CTA, layout) and scaling only what increases conversion rate and ROAS.
Hitting industry benchmarks isn’t enough—beat them with optimized pages from Landingi.
4. Increase average order value (AOV)
Boosting AOV increases the revenue generated per conversion, allowing you to improve ROAS without raising your advertising costs. The higher the transaction value, the more efficient each dollar of ad spend becomes. This is especially important in paid campaigns where customer acquisition cost (CAC) stays fixed – raising AOV is often the fastest way to make those campaigns profitable.
Include marketing strategies such as product bundles, “frequently bought together” recommendations, tiered pricing, or free shipping thresholds to encourage customers to increase their spending. Upselling and cross-selling during checkout can also raise order value without disrupting the user experience. These tactics align with revenue-focused optimization, helping to maximize returns from both new and existing customers.
5. Exclude low-performing placements
Regularly review performance data to identify which advertising channels and ad placements drive spend without meaningful returns. Use platform breakdowns by placement, device, location, and format to compare ROAS, CPA, and conversion volume – not just clicks. Look for patterns over time (not single-day drops) to avoid cutting placements too early.
Pause or limit spending on consistently low-performing placements and reallocate the budget to those delivering stable conversions and a stronger ROAS. Where possible, separate high- and low-performing placements into different campaigns to maintain control and prevent inefficient placements from diluting overall performance.
6. Focus on Customer Lifetime Value (CLV)
Optimize campaigns around long-term value, not just first-purchase ROAS. Identify which audiences, channels, and creatives drive customers with higher repeat purchase rates or subscription retention, and prioritize budget toward those segments – even if initial acquisition costs are higher.
Connect ad platforms with CRM or analytics data to track post-conversion behavior such as repeat purchases, upsells, and churn. Use this insight to adjust bidding, targeting, and messaging toward higher-value customers, ensuring ad spend is optimized for sustainable growth rather than short-term wins. Focusing on CLV improves profitability because acquiring customers who generate more revenue over time allows you to scale spend sustainably without sacrificing margins.
7. Leverage AI and Predictive Analytics
Use AI-driven tools to analyze performance patterns, forecast outcomes, and automate bidding, budgeting, and audience optimization in real time. Predictive models help identify which users are most likely to convert or generate higher value, allowing you to act proactively rather than reactively.
Examples include Google Performance Max, which uses machine learning to optimize across channels, and Meta’s Advantage+ Shopping Campaigns, which automate targeting and creative delivery based on predicted conversion behavior.
What Impact Do Landing Pages Have on ROAS?
Landing pages have a direct and measurable impact on ROAS by influencing how effectively ad clicks convert into revenue. A well-optimized landing page increases the conversion rate, allowing you to generate more sales from the same ad spend, which improves return on ad spend without increasing costs.
Poor landing page performance – such as slow load times, mismatched messaging, or unclear CTAs – leads to high bounce rates and wasted clicks. According to SellersCommerce’s stats, every extra second of load time drops conversions by 7% on desktop and 20% on mobile, while <2s pages convert up to 160% better. Therefore, better load times directly raise ROAS. Since every ad click has a cost, even small improvements in landing page performance significantly boost campaign profitability.
To ensure your landing pages support your ROAS goals, choose Landingi. The platform enables marketers to build, test, and optimize landing pages without code, reducing production time and facilitating rapid iterations. Features like A/B testing, dynamic text replacement, and EventTracker help personalize user experience, monitor behavior, and continuously improve conversion outcomes, all of which contribute to better ROAS across your advertising campaigns.
Ready to outperform your industry ROAS benchmarks? Start optimizing with Landingi now.
Boost Your ROAS with High-Converting Landing Pages – Optimize Now with Landingi
Landing pages are one of the most critical factors influencing Return on Ad Spend. Even with the same targeting and budget, a high-converting page can significantly increase your ROAS percentage by converting more clicks into paying customers. While ad performance starts with audience and creative, it’s the landing page that determines whether that traffic converts.
If you’re aiming for a good ROAS – typically between 2:1 and 4:1, depending on ROAS benchmarks by industry – your landing page must align perfectly with user intent, load quickly, and drive action without friction. Pages that miss these standards waste ad spend, regardless of how optimized your campaign setup may be.
To consistently meet or exceed your ROAS targets, use Landingi. The platform gives you full control over landing page performance with fast editing, A/B testing, dynamic content, and detailed conversion and user interaction tracking through EventTracker. Whether you’re optimizing for search or social campaigns, try Landingi now and improve the part of the funnel that matters most: the moment of conversion.