To make smart marketing decisions in 2025, you need to know the numbers that matter. Data shows what’s working, where to improve, and how your landing pages are performing. Without it, you’re guessing.
Digital marketing expert Evan Bailyn puts it simply: high conversion rates come from choosing the right channels, measuring carefully, optimizing your landing pages, and repeating what works. That process depends on clear, accurate data.
According to FirstPageSage, B2B campaigns average a 1.48% conversion rate. B2C campaigns see about 1.71%. These benchmarks help you spot weak points – especially on landing pages, where most decisions are made.
In this guide, you’ll get the most useful marketing stats for 2025 across SEO, content, social media, and more. Use them to track performance, set goals, and improve your results.
Prefer PDF?
Download the article and enjoy reading it at your convenience.
What Are The Stats on Digital Marketing?
Digital marketing statistics show how people behave online and which strategies bring the best results. In 2025, mobile use, video content, and social media are driving most of the action. These numbers help marketers spend budgets wisely, plan smarter campaigns, and track performance clearly.
Mobile traffic now makes up 59% of all online visits. This shows how important it is to have fast, mobile-friendly websites and content. Video marketing is also strong – 87% of marketers say they get a good return from video content. Platforms like TikTok and YouTube Shorts are helping brands reach younger users where they spend most of their time.
These insights shape more than just ad strategies. They also influence how brands plan content. For example, 49% of U.S. shoppers start their buying journey with a search engine. This makes SEO a must-have for businesses that want steady, high-quality traffic.
The bottom line: smart use of marketing data leads to better results. Stats aren’t just interesting – they’re a practical guide for making better decisions.

How Landing Pages Help You Apply Digital Marketing Statistics?
Landing pages help you turn digital marketing statistics into useful, measurable actions. They aren’t just static pages – they respond directly to what the numbers show.
If data shows rising mobile traffic, your landing page needs to load fast and display cleanly on any screen. Mobile optimization becomes a direct response to that trend, not just a nice-to-have feature. If conversion statistics highlight the value of personalization, your page can reflect that by speaking directly to the visitor’s goals. Clear, relevant messaging makes the data work for you.
A/B testing stats can guide choices like button color, layout, or headline style. If one version consistently performs better, use that format on your landing page. You’re not guessing – you’re applying proven insights.
If research shows that social proof improves engagement, include elements like reviews or testimonials. Place them near the call-to-action where they can influence the visitor’s decision.
Landing pages also allow you to test how these data-driven changes perform in real time. You can track what actually improves results: clicks, sign-ups, or sales. Each test adds clarity and helps you fine-tune your strategy.
Why Are Digital Marketing Statistics Important?
Digital marketing statistics are important because they guide smarter, data-based decisions that lead to better results. They show what content, platforms, or strategies actually connect with people. That makes it easier to focus time, budget, and energy where it counts. Instead of guessing, marketers use hard numbers to measure what’s working and what needs to improve.
For example, 93% of brands say they gained a new customer through a social media video. That’s a clear signal that video is more than a trend – it drives real results. Another key number is the average landing page conversion rate, which is about 10.76%. Marketers use this benchmark to spot weak points and improve conversion strategies.
Statistics also help shape strategy to match what people expect. Personalized email campaigns, for instance, have open rates 14.31% higher than generic ones. That kind of data shows how small changes can bring more engagement and more value from the same effort.
The point is simple: statistics give marketers the clarity to plan smarter, spend better, and grow faster.
Build a landing page that aligns with proven statistics on Landingi, and watch your conversions soar!
7 SEO (Search Engine Optimization) Statistics
Search engines drive over 90% of online activity, making SEO a key part of digital marketing. A well-built SEO strategy helps businesses show up in search results and attract more visitors without paying for ads. These statistics show how factors like mobile performance, click-through rates, and content quality impact visibility and traffic. Understanding these numbers helps you make smarter decisions and get better results from your SEO efforts.
1. Search Engine Usage and Market Share
Google holds a commanding 89.34% of the global search engine market share (Statcounter).
Google leads the search engine market with a mobile share of 95.32% and a desktop share of 81.95% (Swipe Insight).
Year-over-year, there has been a 20% increase in consumer usage of search engines (BrightEdge).
Mobile search is utilized primarily by 80% of Gen Z, 62% of millennials, 66% of Gen X, 35% of Boomers, and 52% of the overall population (HubSpot).
Nearly two-thirds (63.41%) of all web traffic referrals in the US from the top 170 websites originate from Google.com (SparkToro).
Around 15% of all searches on Google are unique and have never been performed before (Google).
2. Organic Search Performance and Click-Through Rates (CTR)
The first position in Google’s organic search results achieves an average click-through rate (CTR) of 27.6%, making it ten times more likely to receive clicks than the tenth position (Backlinko).
Longer keywords typically yield a higher CTR, with phrases containing 10 to 15 words garnering 1.76 times more clicks compared to single-word keywords (Backlinko).
The average CTR for the highest-ranking result is 9.28%, while the second and third positions have CTRs of 5.82% and 3.11%, respectively (ResearchGate).
3. ROI and Organic Search Effectiveness
According to 49% of respondents, organic search is the digital marketing channel that yields the highest return on investment (Search Engine Journal).
49% of consumers in the U.S. begin their online shopping journey by using a search engine like Google (eMarketer).
4. Backlinks and Rankings
Pages with a high number of backlinks tend to rank higher than those with fewer. The top result on Google boasts approximately 3.8 times more backlinks than the sites ranked from second to tenth (Backlinko).
A 13-month study by Semrush revealed that nearly all (92.3%) of the top 100 ranked domains had at least one backlink. In contrast, 55.1% of domains that did not make it into the top 10 lacked any backlinks (Semrush).
5. Content and Search Ranking
On average, a first-page result on Google consists of 1,447 words (Backlinko).
96.55% of all web pages receive no search traffic from Google (Ahrefs).
When Google ignores the title tag, it defaults to using the H1 tag 50.76% of the time (Ahrefs).
6. AI and Automation in SEO
37% of marketers leverage AI to streamline labor-intensive SEO tasks (HubSpot).
84% of bloggers acknowledge that AI and automation have influenced their SEO strategies for 2023 (HubSpot).
83% of survey participants anticipate that AI will positively affect SEO in 2025 (Conductor).
7. Mobile and Local Search Trends
Mobile voice searches tend to be 3x more often focused on local content compared to text searches (Search Engine Land).
The top organic result on mobile devices receives 27.7% of clicks, whereas this figure is only 19.3% for desktops (Demandsage).
5 Content Marketing Statistics
Content marketing generates three times more leads than traditional marketing methods. It builds user engagement and helps brands tell their story clearly. A strong content strategy matters even more now, with AI changing how content is planned and shared. The following statistics highlight how content marketing has shifted into a data-backed, customer-first approach.
Leverage data-backed content with AI-powered landing pages that speak your customers’ language.
1. AI in Content Marketing
67% of small business owners and marketers use AI for content marketing or SEO (Semrush).
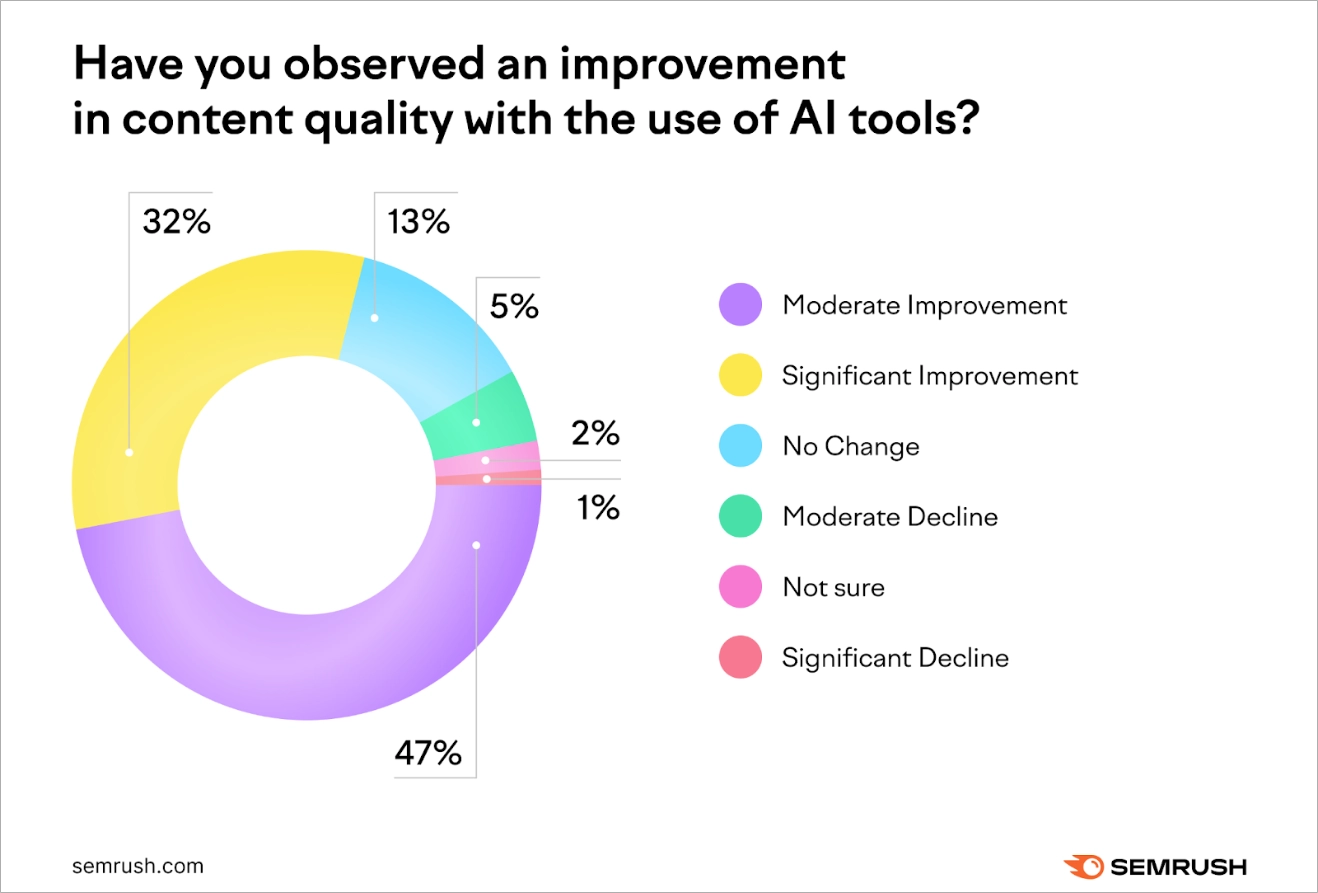
68% of businesses have observed improved ROI in content marketing due to AI (Semrush).
71% of content marketers use AI tools for content ideation, including brainstorming keywords (Siege Media + Wynter).
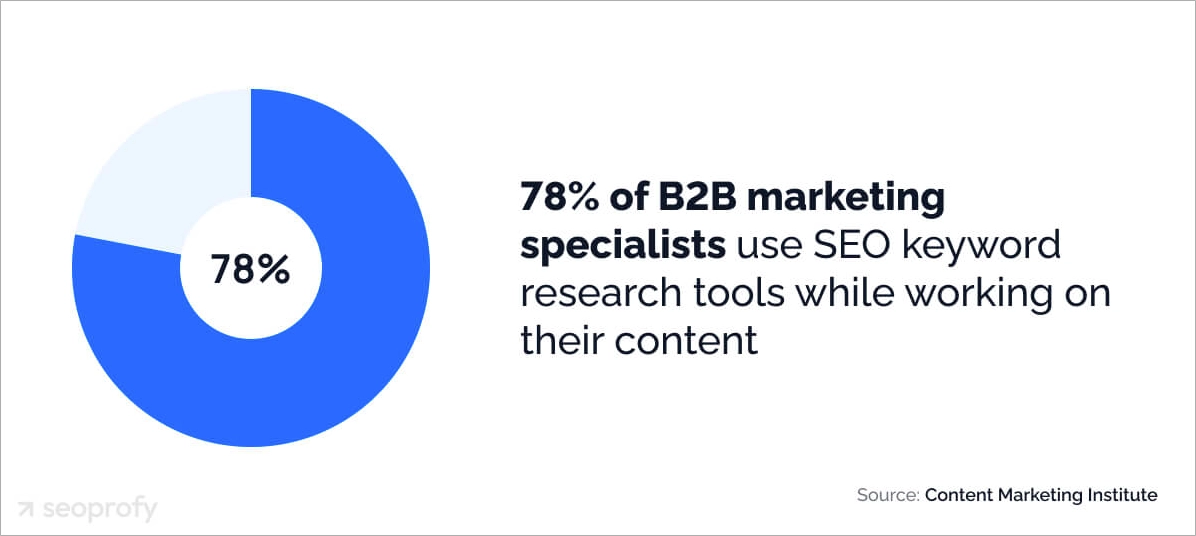
Almost half of content marketers employ AI to generate new topic ideas, 46% for researching headlines and keywords, and 36% for writing, although opinions vary (Content Marketing Institute).
2. Content Types and Distribution Channels
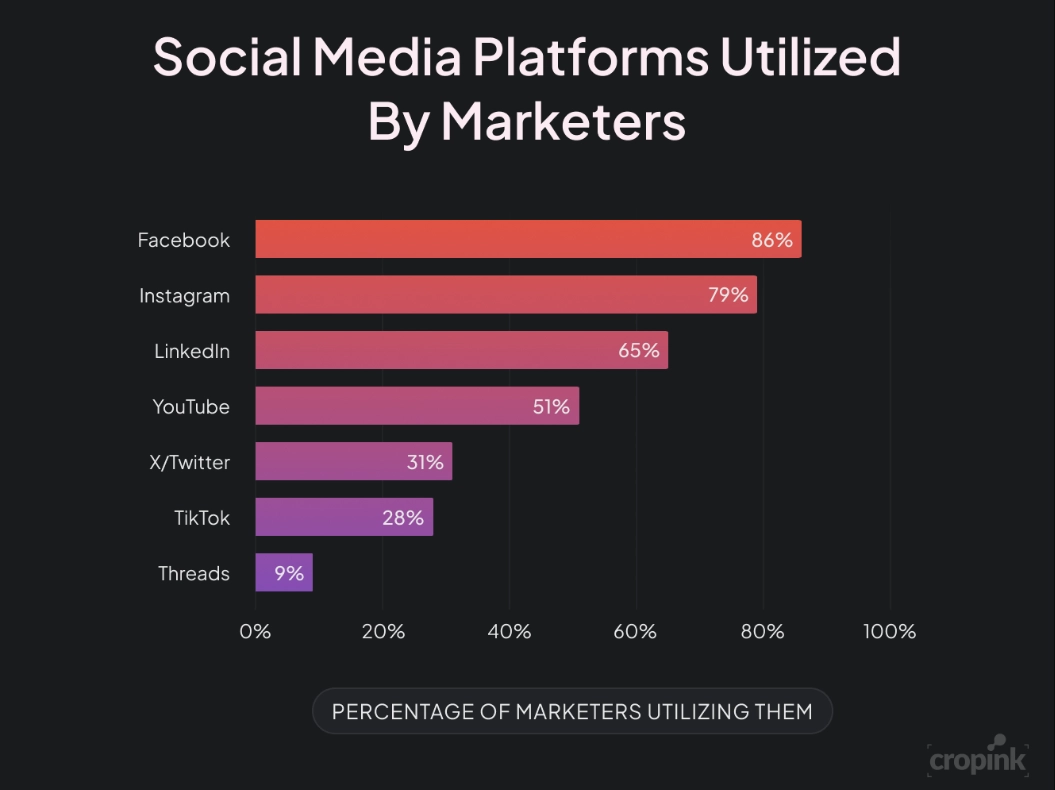
Approximately 90% of B2B marketers utilize social media platforms, while 79% engage in blogging, and 73% leverage email newsletters (Content Marketing Institute).
In 2023, only 36.1% of participants reported creating interactive content, but this figure rose to 62.3% in 2025 (Siege Media + Wynter).
80% of individuals prefer discovering information about a company through tailored content (DemandMetric).
3. Challenges and Priorities in Content Marketing
52% of content marketers indicate that drawing visitors through search engines has become increasingly challenging (Orbit Media).
Link building is gaining importance in 2025, with only 5.5% of respondents not prioritizing it, a decrease from 14.7% in 2023 (Siege Media).
83% of marketers value quality over quantity, even if it leads to less frequent posting (HubSpot).
4. Impact and ROI
Businesses that maintain blogs generate 67% more leads compared to those that don’t (Demand Metric).
Content marketing produces over three times the number of leads as outbound marketing while being 62% more cost-effective (Content Marketing Institute).
72% of marketers assert that their content marketing strategies have boosted engagement and overall traffic (Demandsage).
Among companies that implemented advanced personalization, 70% reported a return on investment of 200% or more (Kibo).
5. Adoption Rates and Technology in Content Marketing
Content marketing is utilized by 73% of B2B marketers and 70% of B2C marketers (Demandsage).
Only 31% of B2B marketers believe their organizations have the appropriate content management technology (Content Marketing Institute).
6 Social Media Marketing (SMM) Statistics
Social media directly shapes how customers discover, interact with, and decide to buy from brands. Billions of users spend time daily on platforms like Instagram, Facebook, TikTok, and LinkedIn. This makes social media one of the most active and responsive channels for digital marketers. Used effectively, these platforms can boost visibility, build trust, and drive measurable business results.
The following statistics show how social media influences buying behavior, brand loyalty, and user engagement. They also reveal where marketers are investing and which platforms deliver the strongest results.
Convert social media traffic into loyal customers with Landingi’s powerful tools.
1. Social Media as a Marketing Channel
18% of respondents view social media as the digital marketing channel that produces the highest return on investment (Search Engine Journal).
52% of social media marketers leverage social media platforms to directly sell products within the apps (HubSpot).
83% of consumers are inclined to visit the social media page of a brand or product they find appealing (Animoto).
2. Social Media Advertising and Spending
By 2028, mobile advertising in the social media sector is anticipated to generate US$255.8 billion (Statista).
It is forecasted that the number of social media advertising users will reach 6,054 million by 2028 (Statista).
3. User Behavior and Demographics
Nearly 50% of Gen Z and Millennials have purchased a product directly through social media platform in the last three months (HubSpot).
21% of consumers favor social media as their go-to source for obtaining answers to their questions (HubSpot).
As of April 2025, men aged 18-24 made up 16.5% of Instagram users, while over half of the user base was 34 years old or younger (Statista).
4. Platform Usage and Engagement Statistics
94.5% of global internet users engage with social media on a monthly basis (DataReportal).
On average, a typical social media user interacts with around 6.8 different platforms each month and spends about 2 hours and 19 minutes daily on social media (GWI).
Adults in the U.S. dedicate 53.8 minutes daily to TikTok, 48.7 minutes to YouTube, and 33.1 minutes to Instagram (Insider Intelligence, eMarketer).
As of Q4 2023, the number of daily active users on Facebook hit 2.1 billion (Statista).
5. Social Media Strategy and Content Trends
71% of social media marketers use AI tools (HubSpot).
86% of social media marketers believe fostering an active online community is essential for successful social media strategies in 2025, with key benefits like enhancing brand awareness (24%), encouraging engagement (21%), reinforcing customer connections (21%), and increasing brand loyalty (20%) (HubSpot).
82% of marketers reuse content across various social media platforms (HubSpot).
80% of marketers consider humorous content the most effective on social media (HubSpot).
6. Social Media Ad Performance Metrics
The click-through rate (CTR) for ads on Instagram is 0.22% in the feed and 0.33% for Stories. Meanwhile, the average CTR for Facebook’s newsfeed is 1.11% (Smart Insights).
8 Video Marketing Statistics
Video content delivers some of the highest engagement and return on investment across digital platforms. Businesses using platforms like YouTube and TikTok see strong performance from well-produced video campaigns. These statistics highlight how video affects reach, viewer behavior, and overall marketing results.
Add video to your landing page with a drag-and-drop builder packed with performance widgets.
1. Usage of Video in Marketing
91% of businesses use video as a marketing tool (Wyzowl).
88% of video marketers consider video to be a vital element of their overall strategy (Wyzowl).
Only 7% of marketers believe their organization fully leverages the potential of video (Content Marketing Institute).
2. Content Types and Production Methods
48% of video marketers primarily produce live-action content (Wyzowl).
Video testimonials are the most prevalent use case in video marketing for 2025, created by 39% of video marketers (Wyzowl).
The percentage of video marketers generating content in-house has decreased to 38% from 60% in 2023 (Wyzowl).
There has been an increase in video marketers relying solely on external vendors for content creation, now at 24%, up from 11% in 2023 (Wyzowl).
A combination of in-house and external teams is used by 38% of video marketers for content creation (Wyzowl).
3. Use of AI in Video Production
75% of video marketers report having utilized AI tools for the creation or editing of marketing videos (Wyzowl).
In 2025, 84% of respondents acknowledged using AI in some capacity during the video production process (Lemonlight).
4. Video Length and Effectiveness
36% of video marketers believe that the ideal length for a marketing video falls between one and three minutes (HubSpot).
27% consider the best duration to be four to six minutes, while 15% prefer seven to nine minutes (HubSpot).
A majority of marketers find success with short-form videos, with 39% stating that videos lasting 30 to 60 seconds are the most effective. Following that, 28% favor a length of one to two minutes, 18% opt for 30 seconds or less, 10% choose two to three minutes, and just 5% prefer videos that are three minutes or longer (Wyzowl).
5. Impact of Video on Marketing Goals
88% of video marketers believe that video has enhanced users’ understanding of their products or services (Wyzowl).
86% of video marketers have seen an increase in web traffic due to video (Wyzowl).
90% of marketers recognize that video marketing has provided a strong return on investment (ROI) (Wyzowl).
93% of businesses gained a new customer after sharing a video on social media (Animoto).
While 60% of marketers aim to boost engagement, an impressive 96% assert that video has supported them in achieving this goal (Motioncue).
Incorporating relevant video content on a landing page can boost conversions by up to 86% (HubSpot).
6. Consumer Preferences and Behaviors
87% of consumers indicate that video quality affects their trust in a brand (Wyzowl).
When shopping online, consumers identified video as the most helpful type of content (Animoto).
A majority of 62% of consumers prefer watching video content on a smartphone, while laptops rank second at 18%, consistent with trends from prior years (Lemonlight).
7. Platforms Used for Video Marketing
YouTube stands out as the leading platform for video marketing, with 90% of video marketers placing their trust in the top video-sharing site. Following YouTube is Facebook with 86%, then Instagram with 79%, and LinkedIn with 76% (Wyzowl).
Virtual reality (49%), 360 video (51%), and TikTok (52%) are recognized as the least effective platforms for video marketing (Wyzowl).
8. YouTube-Specific Statistics
By 2025, YouTube hosts a total of 3.9 billion videos, including 826 million Shorts (Photutorial).
8 Email Marketing Statistics
Email marketing delivers one of the highest returns on investment because it targets users directly and efficiently. Personalization and segmentation make campaigns more relevant, which leads to higher engagement and better results. These statistics explain why email continues to be a reliable tool for connecting with customers and increasing sales.
Email marketing drives ROI—connected landing pages push it further. Discover how integrations in Landingi create smoother, smarter funnels.
1. ROI and Effectiveness
14% of SEJ’s Twitter followers indicated that email marketing delivers the greatest return on investment for their websites (Search Engine Journal).
For every $1 spent on email marketing, marketers can expect an average return of $42 (Litmus).
2. Email Usage and Global Metrics
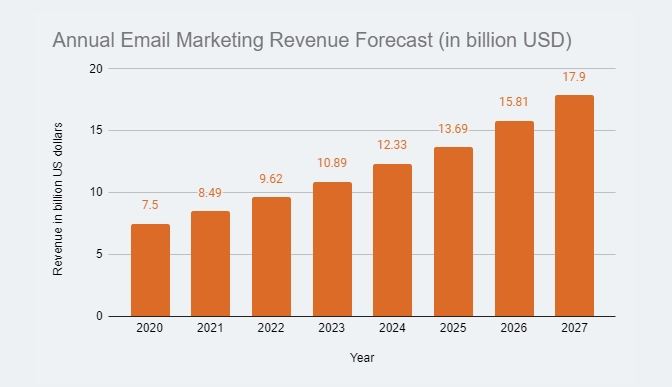
In 2023, there were approximately 4.37 billion global e-mail users, with projections indicating this number will rise to 4.89 billion by 2027 (Statista).
As of April 18, 2025, the United States led the world in the number of daily emails sent, with nearly ten billion messages. Following the U.S., Germany and Ireland each sent around 8.5 billion and 8.4 billion emails daily, respectively. The Netherlands, the United Kingdom, and France all had about 8.3 billion emails sent each day. By December 2023, over 241 million emails were dispatched globally every minute (Statista).
In 2025, it was estimated that a total of 361.1 billion emails were sent around the world. This number is expected to rise further, reaching a projected 408.2 billion daily emails by 2027 (Statista).
3. Email Campaign Performance Metrics
The average email open rate is 39.64% (GetResponse).
The average email click-through rate is 3.25% (GetResponse).
The average email click-to-open rate is 8.62% (GetResponse).
The average email unsubscribe rate is 0.15% (GetResponse).
The average email spam complaint rate is below 0.01% (GetResponse).
The average email bounce rate is 2.33% (GetResponse).
The communications sector saw the highest open rates, rising from 48.8% in 2022 to 65.1% in 2023 (GetResponse).
As of August 2025, the average open rate for email marketing across all industries is 32.55% (Constant Contact).
The average click-through rate for email marketing campaigns is 1.4%, while the bounce rate averages 10.4% (Forbes).
4. Campaign Objectives and Preferences
A 2023 survey revealed that 16% of global marketers identified product awareness and promotions as the primary goals of their email marketing efforts (Statista).
In a survey conducted among marketers across nine countries, the conversion rate emerged as the top metric to assess the success of email marketing campaigns, with 26.5% of professionals utilizing it, aside from the open rate. The click-through rate (CTR) was the second most favored metric, selected by nearly 24% of marketers (Statista).
5. Timing and Frequency
In 2023, approximately 35% of marketers indicated that Tuesdays were the favored weekday for dispatching email marketing campaigns (Statista).
6. Personalization and Segmentation
Segmented email campaigns experience open rates that are 14.31% higher and click rates that are 100.95% higher compared to non-segmented campaigns (Mailchimp).
In 2023, about 65% of marketing professionals in various countries reported that they included personalized subject lines in more than half of their email marketing campaigns, while 9% did not use any personalized subject lines at all (Statista).
Personalized emails can boost open rates by 26% (Forbes).
7. Automation and AI Usage
At the beginning of 2025, e-mail was identified as the channel most dependent on marketing automation, with 58% of professionals favoring it over content and social media management (Statista).
Among marketers utilizing AI, 49% create email content using this technology (HubSpot).
62% of email marketing teams take two or more weeks to create an email (HubSpot).
8. Audience Behavior and Preferences
78% of individuals review their emails before heading to work, and approximately 11% of Americans check their emails as soon as they wake up (Sleep Advisor).
About 30% of millennials look at their emails within 15 minutes of getting up (Sleep Advisor).
79% of millennials and 57% of Gen Z respondents appreciate being contacted by brands through email (Statista).
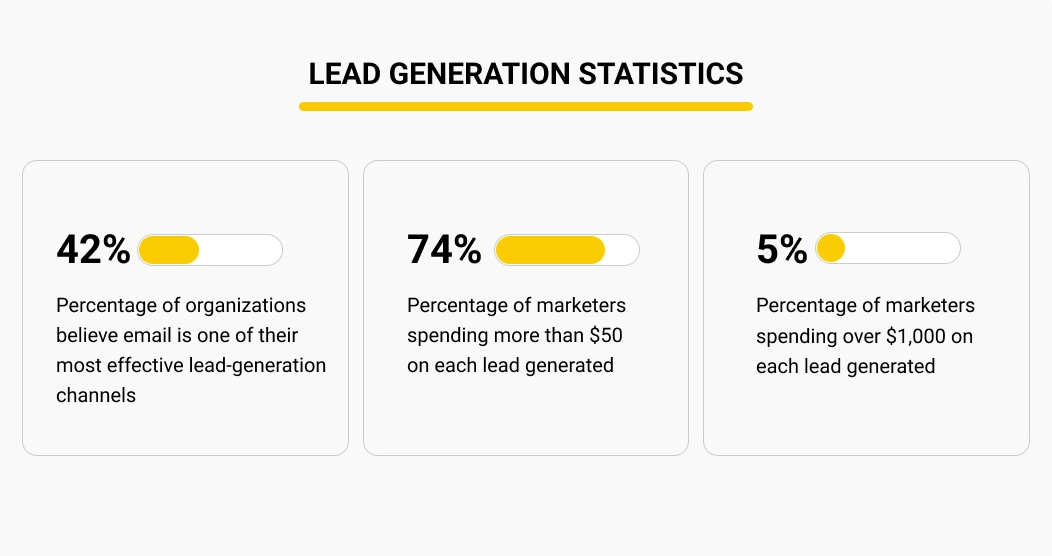
6 Lead Generation Statistics
Quality lead generation is the main focus for most marketers because it directly impacts sales growth. Marketers keep improving their strategies to attract the right people and turn them into customers. The numbers below show what’s working, what’s not, and where teams are focusing their time and budget. They also highlight challenges many marketers face when trying to scale their efforts or improve conversion rates.
The stats don’t lie: landing pages are key to capturing quality leads—make sure they’re part of your strategy.
1. Lead Generation Importance and Goals
91% of marketers consider lead generation to be their top priority (Ruler Analytics).
53% of marketers dedicate more than half of their budget to lead generation (Ruler Analytics).
2. Challenges in Lead Generation
In 2023, the primary challenges for marketers included volume at 27.8% and lead generation at 22.6% (Siege Media).
A significant 37% of marketers identified high-quality lead generation as one of their foremost challenges (Ruler Analytics).
15% of marketers faced difficulties with traffic and lead generation (HubSpot).
3. Tactics and Methods
84% of marketers use form submissions to generate leads (Ruler Analytics).
According to 27% of marketers, organic search is the leading source for generating leads (Ruler Analytics).
More than half (54%) of content marketers believe that targeting leads in the early stages of the buyer’s journey is the most valuable aspect of content marketing (CMI).
An impressive 87% of video marketers report that video has significantly contributed to their lead generation efforts (Wyzowl).
4. Lead Quality and Qualification
A significant majority (78%) of marketing and sales professionals indicate that they evaluate the quality of their leads to some degree (Ascend2, Verse).
Only 39% of companies implement lead qualification criteria within their lead generation strategies (Ascend2, Verse).
Just 12% of digital marketers express a high level of satisfaction with their lead conversion capabilities (Ascend2, Verse).
5. Lead Nurturing and Follow-Up
80% of new leads do not result in sales, while businesses that excel in lead nurturing produce 50% more ready-to-buy leads at a 33% lower cost (Invesp).
When you follow up with a lead within 5 minutes, your chances of converting them increase by 9 times (LaGrowthMachine).
41% of companies find it challenging to follow up with leads promptly (Ascend2, Verse).
6. Lead Generation Timing
Typically, 44% of leads are generated outside of conventional “business hours” (such as mornings, evenings, and weekends) (Ascend2, Verse).
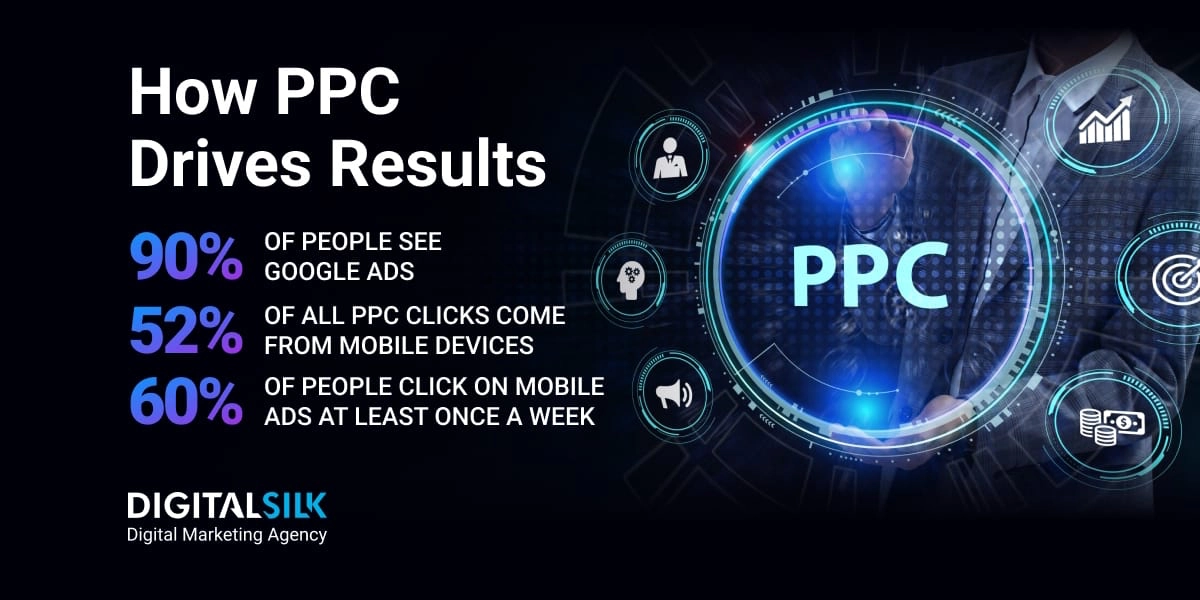
6 PPC (Pay-Per-Click) Statistics
PPC advertising helps brands appear quickly in search results and reach people ready to take action. It’s one of the most direct ways to drive traffic and conversions with clear, measurable results. The data below shows how PPC continues to play a major role in digital ad strategies.
Your ads work hard—let landing pages seal the deal. Align message and design to turn clicks into conversions.
1. Return on Investment and Revenue Impact
19% of respondents believe that online advertising and paid search campaigns provide the highest returns for their websites (Search Engine Journal).
Businesses earn an average of $2 in revenue for every $1 invested in Google Ads (Google Economic Impact Report).
PPC ads in search results capture 45% of all page clicks (WebFX).
Google Ads can lead to an 80% boost in brand awareness (Ranktracker).
2. Reach and User Base
YouTube ads connect with 2.53 billion users monthly, surpassing Meta’s reported 2.22 billion users for Facebook by over 10 percent (DataReportal, Kepios).
In a 2023 survey, an impressive 98% of pay-per-click marketers indicated they utilized Google search advertising, while Bing, Google’s competitor, was referenced by 67% of the respondents (Statista).
3. Cost of PPC Advertising
In search marketing, the sectors with the lowest cost per click (CPC) are real estate and arts & entertainment, averaging $1.55 (WordStream).
In 2025, the average cost for pay-per-click (PPC) advertising ranges from $100 to $10,000 per month, with typical click costs between $0.11 and $0.50, and costs per 1,000 impressions between $0.51 and $1.00 on platforms like Google Ads and Microsoft Ads (WebFX).
4. Click-Through Rate (CTR)
The average click-through rate (CTR) for search ads across all industries is 6.64%, while for display ads it is 0.57% (CXL).
In Google Ads, the overall average CTR is 3.17% for search ads and 0.46% for display ads (WordStream).
Text ads receive the highest click rates, with an average of 49%% (Ranktracker).
A significant 65% of all clicks on Google Ads come from users with high commercial intent (Ranktracker).
5. Global and Industry Spending
In 2022, global expenditure on search advertising reached 164.6 billion U.S. dollars, with projections indicating an increase to approximately 190.5 billion dollars by the end of 2025 (Statista).
Total digital advertising spending worldwide was 549.51 billion U.S. dollars in 2022, and forecasts suggest it could rise to 870.85 billion dollars by 2027 (Statista).
Google and Facebook dominate the advertising landscape, together accounting for over 60% of total ad spending (Ranktracker).
6. Consumer Attitudes and Brand Awareness
Search ads boost brand awareness by 80% among consumers (Google).
A significant 33% of individuals find display ads to be “intolerable,” leading to frustration (Ranktracker).
Combining ads on TikTok with television advertising can yield a 21% additional impact on brand perception (TikTok).
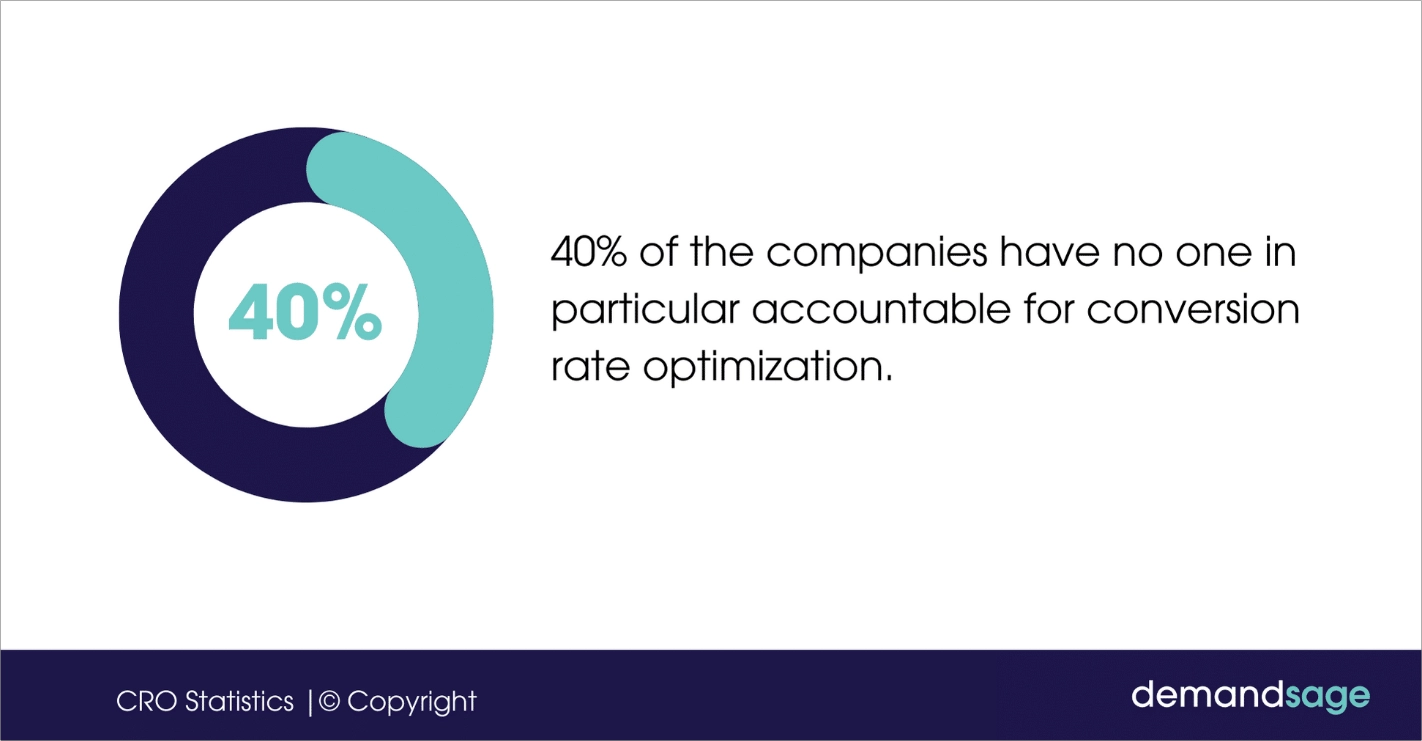
5 Conversion Rate Optimization (CRO) Statistics
CRO helps you get more results from the same amount of site traffic. It increases efficiency without needing to grow traffic. Faster load times, simpler forms, and better user experience all impact conversion. The statistics below show how small changes can lead to better results.
Use data-driven landing pages to test, tweak, and improve conversion—without guessing.
1. User Experience & Loading Speed
An ineffective user experience can lead to losing 89% of potential customers to rival companies (WebFX).
Research shows that pages that load in 2.4 seconds have a conversion rate of 1.9%, which decreases to 1.5% at 3.3 seconds and falls below 1% at 4.2 seconds (Cloudflare).
53% of mobile users abandon a page if it takes more than 3 seconds to load (Think with Google).
2. Average Conversion Rates
The typical conversion rate for landing pages across different sectors is 10.76% (GetResponse).
Approximately 29.5% of landing pages are overloaded with text, leading to an average conversion rate of 11.10%. In contrast, landing pages that prioritize concise wording reach an average conversion rate of 14.30% (Unbounce).
3. Conversion Optimization Tools & Strategies
Some conversion rate optimization (CRO) tools can enhance conversion rates by as much as 223% (VentureBeat).
Companies utilizing optimization software on their landing pages typically see an average increase of 30% in conversions, while mobile-optimized pages yield more leads and expand their audience reach (Mailchimp).
A significant 70% of marketers consider A/B testing crucial for improving conversion rates (ZipDo).
4. Form Optimization
Cutting down the number of fields in a contact form can greatly enhance conversion rates. For instance, one company saw a 120% surge in conversions after trimming their form from 11 fields to just 4 (Unbounce).
Reducing the fields from 4 to 3 can lead to a 50% increase in conversion rates (Search Engine People).
5. Analytics & Tracking
Google Analytics is the leading platform for understanding user behavior and overseeing website performance (UXtweak).
Over a third of marketing executives identify conversion rates as a primary key performance indicator they focus on monitoring (HubSpot State of Marketing Report).
7 Affiliate Marketing Statistics
Affiliate marketing helps brands grow by partnering with others who promote their products or services. It offers a low-cost way to boost sales and track performance. Spending keeps rising as more companies see strong results. Marketers now rely on affiliate programs to improve efficiency and increase revenue. Influencers and creators also use affiliate links to earn income through promotion. This model rewards both brands and partners based on actual sales. As usage grows, so does the need for better tracking tools.
Smarter affiliates use tailored landing pages. Join them today and start building for free.
1. Budget Allocation and Financial Projections
In 2021, affiliate marketing accounted for an average of 9% of marketing budgets (Influencer Marketing Hub).
In 2023, spending on affiliate marketing in the United States reached 9.56 billion U.S. dollars, with projections of 10.72 billion in 2025 and approximately 12 billion in 2025 (Statista).
The global market for affiliate marketing platforms is expected to reach US$ 39,805.4 million by 2031 (Astute Analytica).
2. Market Interest and Usage Trends
Between 2020 and 2022, interest in affiliate marketing surged by over 264% (Influencer Marketing Hub).
As of October 2025, 1.37% of the top one million websites were utilizing Amazon Associates, making it the leading affiliate program, while Awin followed as a close second at approximately 0.7%. Overall, 5.3% of the top one million sites engaged in affiliate programs (Statista).
3. Affiliate Marketing Strategies and Partners
Over 25% of brands engage bloggers as part of their affiliate marketing strategies (Influencer Marketing Hub).
More than 80% of brands leverage affiliate programs to boost brand visibility and drive sales (Demandsage).
28% of marketers consider innovative partnerships to be a significant advantage, while 25% value having control over specific marketing results as a key selling point (Statista).
4. Program Efficiency and Revenue Impact
Well-designed affiliate programs can increase revenue by as much as 30% (Webtribunal).
SaaS products provide affiliates with commission rates that vary from 20% to 70% (Influencer Marketing Hub).
5. Challenges and Risks
Over 67% of brands are concerned about affiliate fraud, yet fewer than 30% have actually experienced its impact (Influencer Marketing Hub).
6. Technology and Content Creation
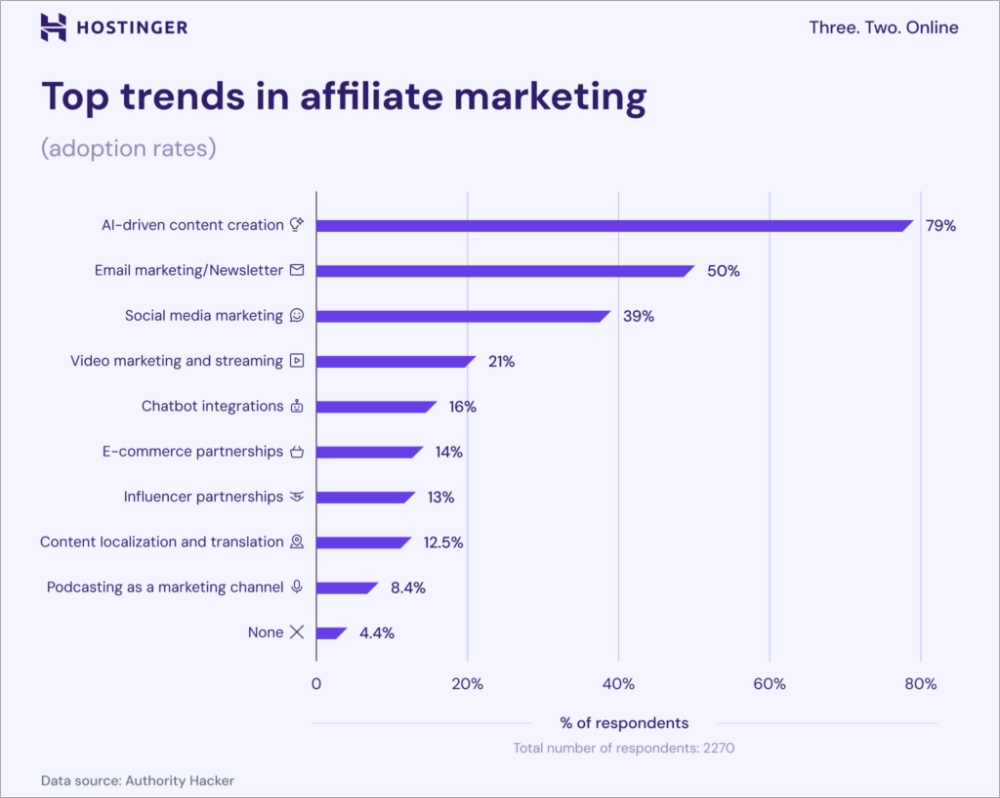
79.3% of affiliate marketers utilize AI-powered content generation, and blogging (79.1%) remains the main promotional strategy (AuthorityHacker).
7. Affiliate Marketer Compensation
The typical salary for an affiliate marketer in 2025 is $56,141 (PayScale).
9 Influencer Marketing Statistics
Influencer marketing drives strong consumer trust, engagement, and sales, especially on platforms like Instagram and TikTok. These statistics show how influencer content affects buying decisions and brand perception.
Personalized experiences convert. See how custom landing pages can align perfectly with your campaigns.
1. Influencer Collaboration and Marketing Spend
In 2023, 54% of B2C marketers collaborated with creators or influencers, with 49% planning to boost their investment in influencer marketing for 2025 (HubSpot).
Approximately 26% of marketers utilize influencer marketing strategies (HubSpot).
Among companies that partnered with both smaller creators (those with fewer than 100,000 followers) and larger ones, 44% valued the more affordable costs of these collaborations (HubSpot).
A global survey conducted in 2025 revealed that 37.6% of respondents indicated their organizations collaborated with up to 10 influencers, while 14.7% worked with more than a thousand influencers (Statista).
59.4% of marketers plan to increase their spending on influencer marketing (Influencer Marketing Hub).
2. Types of Influencers and Engagement
67% of marketers collaborate with micro-influencers who have between 10,000 and 100,000 followers, while only 29% engage with mega influencers boasting over 1 million followers(HubSpot).
In 2023, 21% of businesses aimed to partner with nano-influencers, while 53% targeted micro-influencers. Additionally, 65% planned to work with macro influencers, and 42% expressed interest in mega-influencers (HubSpot).
TikTok’s nano-influencers, who have 1,000 to 10,000 followers, achieved the highest engagement rate worldwide in 2023, reaching 11.97%. Micro-influencers with 10,000 to 50,000 followers followed closely behind with an engagement rate of 10.21% (Statista).
3. Consumer Trust and Influencer Impact on Buying Decisions
69% of consumers place more trust in influencers, friends, and family than in brand messages (Marketing Dive).
63% of consumers are more inclined to purchase products endorsed by a trusted influencer (Traackr).
79% of individuals report that user-generated content influences their purchasing choices (Nosto).
78% of TikTok users have made a purchase after engaging with content created by TikTok creators (TikTok).
4. Types of Influencers and Associated Costs
The various categories of influencers available for hire, including their price per post on Instagram:
5. Influencer Marketing Market Size and Growth
- Nano (1k-10k followers) – $20-$200
- Micro (10k-50k) – $35-$450
- Mid (50k-500k) – $150-$2500
- Macro (500k-1M) – $350-$7000
- Mega (1M+) – starting at $1200 (HypeAuditor)
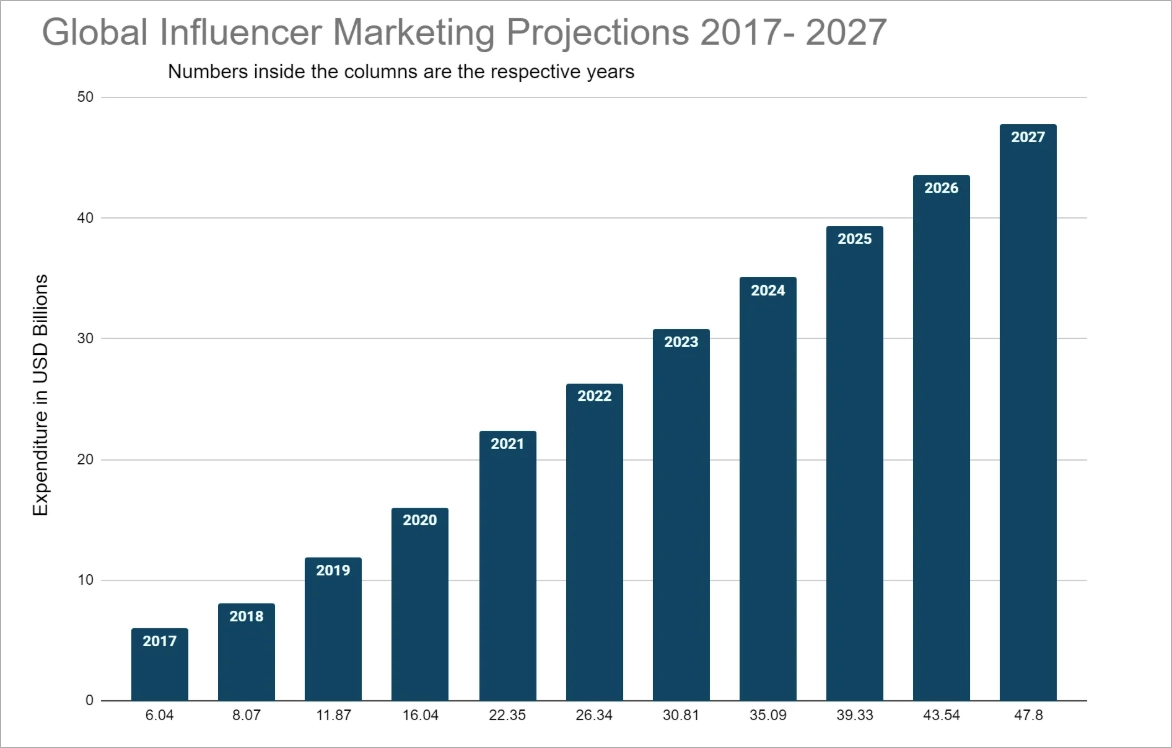
As of 2023, the value of the global influencer marketing market was 21.1 billion U.S. dollars, more than three times its size since 2019 (Statista).
The global influencer marketing market is projected to hit a new high of 24 billion U.S. dollars in 2025 (Statista).
6. Campaign Goals and Success Metrics
The primary goal of influencer campaigns is to generate User Generated Content, accounting for 56% of the focus. Generating sales comes in a far second at 23% (Influencer Marketing Hub).
On average, you can earn $4.21 for every $1 invested in an Instagram influencer (HypeAuditor).
7. Challenges in Influencer Marketing
28% of social media professionals find it challenging to stay updated on influencer marketing trends (Statista).
8. Popular Content Categories Among Influencers
In 2023, 8.35% of Instagram influencers targeted beauty subjects, ranking it as the third most favored category. The lifestyle category held the top position, with a share of 13.73% (Statista).
9. Consumer Preferences in Influencer Types
61% of customers are most drawn to relatable personalities, while expert personalities appeal to 43% of them, just-for-fun personalities to 32%, and aspirational personalities to 28% (Marketing Dive).
5 Inbound Marketing Statistics
Inbound marketing attracts high-quality leads more effectively and at a lower cost than outbound tactics. Strategies like SEO, content, and social media help build trust and long-term customer loyalty. This section shares data on lead quality, conversion rates, and cost savings to explain why inbound works. You’ll see why many marketers choose it over traditional methods.
Use landing pages to turn inbound marketing insights into real results. Free to start, easy to scale.
1. Cost Effectiveness
Inbound leads generally have a cost that is 61% lower than that of outbound leads, and 75% of inbound marketing channels are more affordable than any outbound channel (Invesp).
2. ROI and Success Rates
Marketers who focus on blogging are thirteen times more likely to achieve a positive return on their investment (OptinMonster).
66% of B2B marketers often emphasize their audience’s needs over promoting sales when crafting content, which is in line with the principles of inbound marketing. Among the most effective content marketers, 88% adopt this approach (CMI).
60% of marketers believe that inbound strategies, such as SEO and blog content, yield their highest quality leads (HubSpot).
3. Usage and Strategy Preference
70% of B2B marketers utilize content to create demand and generate leads (Taylor Scher).
25% of marketers focus on video content, while podcasts account for 10%, with images, blog posts, and case studies representing single-digit percentages (HubSpot).
20% of respondents consider content marketing to be the most effective strategy for digital inbound marketing (Statista).
4. Audience Engagement
Approximately 409 million individuals access more than 20 billion blog pages each month (Optinmonster).
5. Inbound Marketing Channels
A study on inbound marketing found that email marketing ranks as the most effective online strategy for acquiring customers (81%) and retaining them (80%) (Emarsys).
6 Landing Page Statistics
Landing pages help boost conversions and collect leads in digital marketing. Data shows that clear design, fast loading, and focused content improve results. Many pages fail due to cluttered layouts or slow speeds, which drive users away. Using statistics helps marketers test and improve their landing page performance.
Good design drives results. Start building sleek, high-performing landing pages at zero cost.
1. Landing Page Conversion Rates
The average conversion rate for landing pages across different industries is 10.76% (GetResponse).
A standard conversion rate for email opt-in landing pages typically falls between 5% and 15% (Leadpages).
Landing pages that load in 2.4 seconds achieve a conversion rate of 1.9%, which declines to 1.5% at 3.3 seconds and drops below 1% at 4.2 seconds (Cloudflare).
Incorporating videos into landing pages can boost conversion rates by 80% (Ecom Convert).
Adding social proof beneath a landing page’s call to action can enhance its conversion rate by 68% (HubSpot).
Featuring multiple offers on your landing page can result in a 266% reduction in conversions (Alphawhale).
Nearly 66% of marketers indicate that their average landing page conversion rate is below 10% (HubSpot).
A personalized landing page can improve the effectiveness of PPC ad campaigns by 5% (Ranktracker).
2. Costs and Pricing
The average cost of creating a landing page with design tools is $113 (Apexure).
Monthly fees for landing page builders range from $0 to $399, varying based on the provider and selected plan (Landingi).
3. Page Load Speed and Performance
On 70% of mobile landing pages, the visual content above the fold takes more than 5 seconds to appear. It can take over 7 seconds for all visual content, both above and below the fold, to fully load (Think with Google).
According to 47% of respondents, users expect landing pages to load in 2 seconds or less (Cloudflare).
4. Content and Design
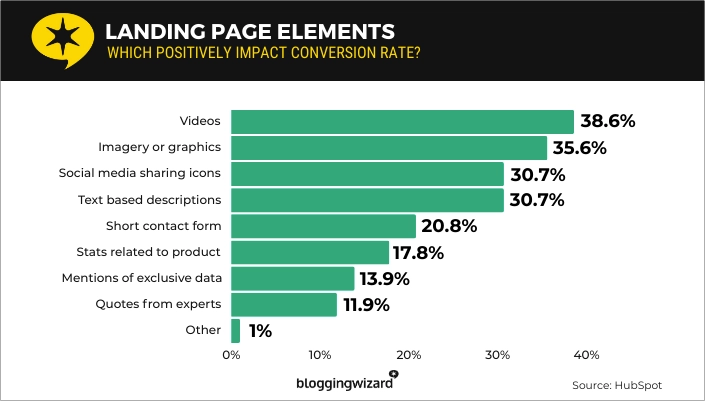
53% of landing pages utilize videos to effectively communicate product value, as videos tend to be more engaging than images, even though they come with higher production costs (ChartMogul).
The average headline length for landing pages remains consistent at 6 words, with 88% of headlines consisting of fewer than 10 words (ChartMogul).
29.5% of landing pages feature excessive text, leading to an average conversion rate of just 11.10%, while pages that are mindful of word count achieve a higher average conversion rate of 14.30% (Unbounce).
5. User Engagement and Experience
Interactive landing pages can enhance the effectiveness of communications by 79% (Thrive Myway).
6. Lead Generation and Marketing Goals
Expanding the number of landing pages from 10 to 15 could lead to a 55% rise in leads for businesses (HubSpot).
For 43.6% of marketers, the primary objective of creating landing pages is to generate leads (HubSpot).
Use Digital Marketing Statistics to Optimize Landing Pages with Landingi
Digital marketing statistics help you build landing pages that match what your audience expects and responds to. Data from SEO, content trends, social media, and video engagement shows where users spend time and how they interact. These numbers let you see which platforms give better ROI and where attention is shifting.
Using this data, you can adjust your campaigns to focus on what works. You’ll make more informed choices that improve customer experience and lead to stronger results. Stats also highlight how user behavior is changing – like increased mobile browsing or short-form video preferences. That insight helps shape landing pages that load quickly, include video, and use strong, clear calls to action.
Landing pages built with these insights convert more visitors into customers. Research shows that using specific statistics leads to better page performance than traditional guesswork. With Landingi, you can apply these findings without needing to code or use outside tools. Try the platform for free to build landing pages that reflect real user data, increase engagement, and improve results across your marketing funnel.