Understanding user behavior is essential for optimizing websites and landing pages and maximizing conversions. Heatmap tools have become indispensable for businesses to visualize user interactions, fine-tune landing page layouts, and make data-driven decisions that improve performance. As digital marketing expert Neil Patel puts it, “This knowledge puts you ahead of your competitors and helps you convert more visitors into customers.”
In this comprehensive guide, we’ll explore the top 8 heatmap software tools – each offering practical ways to analyze behavior, enhance ecommerce, and optimize landing pages to boost conversion rates.

1. Best Free Heatmap Software: Microsoft Clarity
Best free heatmapping software is Microsoft Clarity. It provides essential features, an intuitive interface, and detailed behavioral analytics – all at no cost.
Functionalities
Microsoft Clarity helps analyze user behavior by showing how visitors interact with your website. Heatmaps and session recordings highlight where users click, scroll, and pause, revealing areas that may need improvement.
Ease of Use
The interface is simple and well-organized. Both beginners and experienced users can start analyzing data quickly without a learning curve.
Data Analysis
Clarity captures real-time interactions. It shows exactly how users navigate pages, enabling site owners to understand engagement patterns and identify friction points.
Integrations
Clarity integrates well with Microsoft platforms. However, it supports fewer third-party tools compared to some other heatmap software.
Price
Microsoft Clarity is entirely free. This makes it ideal for startups and small businesses that need user behavior insights without investing in premium tools.

Pros of Microsoft Clarity
- Free Use: Microsoft Clarity’s cost-effectiveness makes it an excellent choice for startups and small businesses that are operating on a tight budget but still want to gain valuable insights into visitor engagement on their website.
- User-friendly Interface: Microsoft Clarity’s interface is intuitive and easy to navigate, making it accessible for beginners and experienced users alike.
- Session Recordings: This feature allows you to replay individual user sessions, gaining a deeper understanding of how users interact with your website.
- Heatmaps: Microsoft Clarity provides click-and-scroll heatmaps, which offer a visual representation of user interactions and engagement on your website.
- Insights Dashboard: This dashboard provides a quick overview of your website’s performance, including metrics like active users, session length, and click-through rates.
Cons of Microsoft Clarity
- Limited Advanced Features: As a free tool, Microsoft Clarity does not offer the same range of advanced features as some paid heatmap software.
- Data Retention: Microsoft Clarity retains data for a limited time, which may not be sufficient for long-term analysis.
- Learning Curve: While the interface is user-friendly, it may take some time for users to fully understand and utilize all of the tool’s features.
Despite these potential drawbacks, Microsoft Clarity remains a strong contender for businesses seeking a free, comprehensive heatmap software tool.
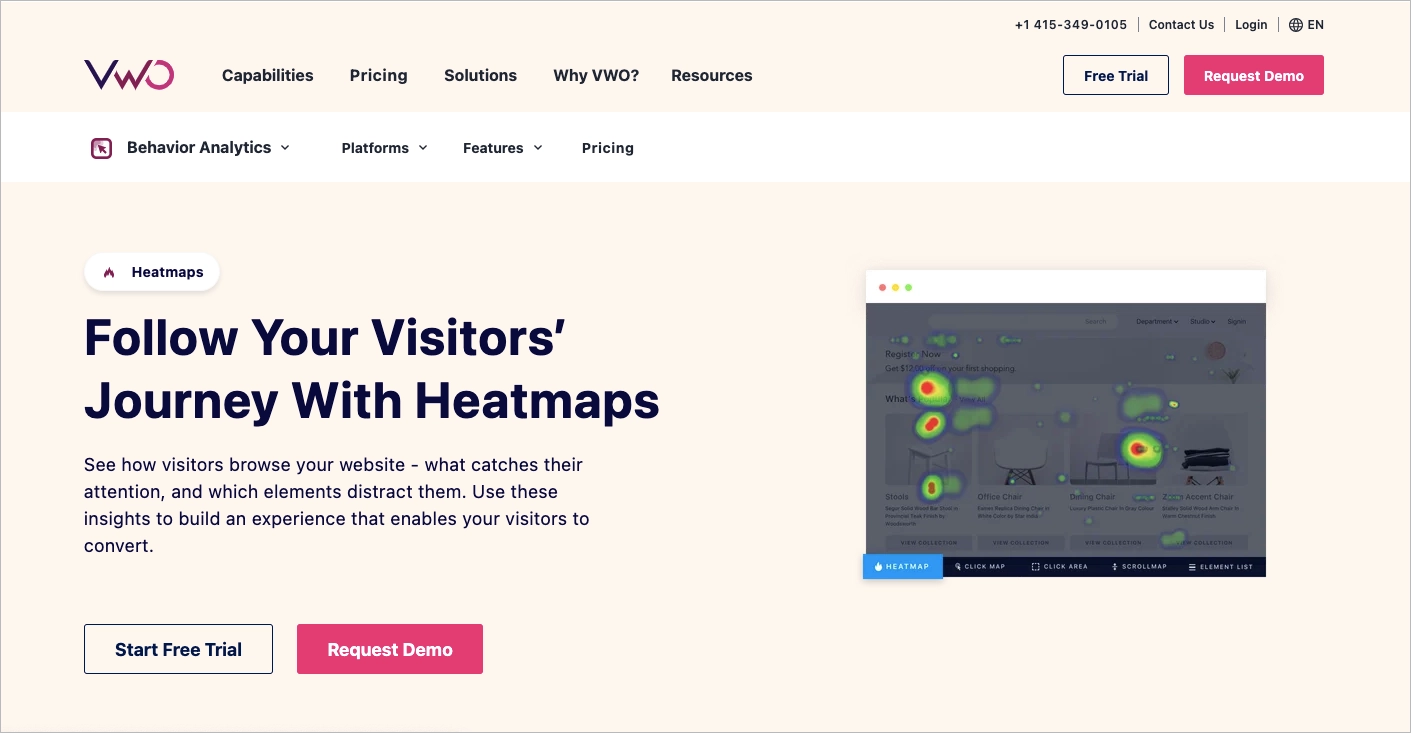
2. Best Heatmap Tool For Data Analytics: VWO
Best heatmapping software for data analytics is VWO (Visual Website Optimizer). This tool is a strong choice for marketers and optimization professionals focused on data-driven insights. It delivers features that help analyze user behavior and improve engagement.
Functionalities
VWO includes more than basic heatmaps. It supports advanced behavior tracking and strategic planning, making it useful for conversion optimization.
Ease of Use
The interface is generally user-friendly. However, some users may encounter minor usability issues during navigation.
Data Analysis
VWO enables in-depth analysis of user interactions. These insights support decisions that improve page performance and engagement.
Integrations
VWO connects with major platforms. It supports campaign creation without disrupting existing workflows.
Price
VWO is a paid service. Pricing varies by usage, with VWO Insights starting at $206 per month. Its data capabilities can justify the cost for teams focused on optimization.
Pros of VWO
- Heatmaps: VWO’s heatmaps provide a color-coded representation of how users interact with your website, highlighting areas of high and low engagement. It includes clickmaps, scrollmaps, click areas, and element lists.
- Surveys: With VWO’s survey feature, you can gather user feedback and qualitative data from your visitors, gaining insights into their preferences and motivations.
- User Recordings: VWO’s session recording tool give you a first-hand look at how users navigate and interact with your website, helping you identify any usability issues that may be hindering conversions.
- Customizable Visitor Segments: Enables filtering of heatmap reports using complex logic or predefined segments.
- Collaboration Tools: Features like adding observations and sharing heatmaps facilitate teamwork.
Cons of VWO
- Cost: VWO is a premium service. Its advanced features come at a price, which might be a consideration for smaller businesses. It has a free plan available, but it doesn’t include all the features.
- Complexity: The depth of features in VWO can be overwhelming for beginners. It requires a learning curve to fully exploit its capabilities.
- Resource Intensity: The comprehensive nature of VWO’s tools can demand significant resources, both in terms of time and technical expertise, to manage effectively.
VWO’s strengths make it an unparalleled choice for businesses serious about leveraging heatmap data for website optimization. The value it delivers in deep insights and actionable data is unmatched, making it the best heatmap tool for data analysis.
3. Best Heatmap Tool For Optimizing UX: Crazy Egg
Best heat map software for optimizing UX is Crazy Egg. It offers features that help analyze user interactions and optimize site design based on real behavior.
Functionalities
Crazy Egg captures webpage snapshots and tracks where visitors click. It includes multiple heatmap types, session recordings, and built-in A/B testing tools.
Ease of Use
The platform is easy to navigate and suitable for both beginners and experienced users.
Data Analysis
Crazy Egg helps identify how users interact with your site. It allows custom analysis and comparison of traffic sources to support UX improvements.
Integrations
Crazy Egg works with various third-party tools, making it adaptable for different workflows.
Price
Plans start at $29 per month. A 30-day free trial allows users to test the platform before committing.

Pros of Crazy Egg
- Heatmap Capabilities: Crazy Egg provides heatmap solutions, including click, scroll, and mouse movement heatmaps. It helps in identifying hotspots and areas needing improvement on a website.
- Session Recordings: Session recordings allow marketers to observe individual user journeys. It is crucial for optimizing user experience.
- Multiple Report Types: Offers various reports like Heatmap, Scrollmap, Confetti, Overlay, and List, each providing unique insights into user engagement.
- Analytics and Reporting: The tool provides detailed analytics and customizable reports, offering deep insights into website performance and user engagement.
- User Segmentation: Crazy Egg allows for the segmentation of user data, enabling more targeted and effective analysis. This feature aids in tailoring optimization strategies to different user groups.
- Extended Data Retention: Crazy Egg offers 1-year data retention, facilitating long-term analysis and historical data comparison.
- User Interface: Crazy Egg’s interface is well-organized and straightforward. It is designed to be intuitive, making it easy for users of all experience levels to navigate through the platform and utilize its features.
Cons of Crazy Egg
- Cost: The entry-level plan costs $49 per month, and comes with certain usage restrictions.
- Mobile Responsiveness Issues: There are often challenges in accurately tracking and displaying user interactions on various mobile devices
Crazy Egg’s features collectively make it an exceptional choice for professionals dedicated to enhancing UX and maximizing website performance. The investment in this website heatmap tool is justified by the substantial value it brings to user experience optimization and conversion rate enhancement.
4. Best Heatmap Tool For Understanding User Behavior: Hotjar
Best heat map tool for understanding user behavior is Hotjar. It’s widely adopted for its ability to identify pain points and improve user experience.
Functionalities
Hotjar tracks user movement, clicks, and scroll depth on web pages. These insights help pinpoint usability issues and guide site improvements.
Ease of Use
The platform is easy to use. Site owners can quickly access user interaction data without needing technical expertise.
Data Analysis
Hotjar supports experience analysis through its dashboard. Users can detect bugs, monitor feature adoption, and track campaign performance.
Integrations
Hotjar connects with many popular tools. These integrations extend its functionality without requiring custom development.
Price
Pricing depends on session volume. A free plan includes up to 35 daily sessions, with paid plans starting at $32 per month and adjusting for higher traffic needs.

Pros of Hotjar
- User Behavior Insights: Hotjar heatmaps show where users move, click, and scroll, providing deep insights into user engagement and behavior.
- Optimization for All Devices: It is designed to work seamlessly across different devices, ensuring a consistent analysis of user behavior.
- Usage: Over 7.5 million heatmaps have been created using Hotjar, demonstrating its widespread acceptance and reliability.
- Additional Tools for Enhanced Analysis: Hotjar comes with four extra tools (Recordings, Feedback, Surveys, and Interviews) that complement heatmaps for a more rounded user experience analysis.
- Long-Term Data Storage: Offers 365 days of data storage, allowing for long-term analysis and comparison.
- Free Access with Unlimited Heatmaps: Available for free, providing unlimited heatmaps on all plans.
Cons of Hotjar
- Limited Customization in Free Version: Some advanced customization features might be restricted in the free version.
- Potential Overload of Information: The extensive data provided can be overwhelming for new users or small teams.
Hotjar is an invaluable tool for anyone looking to gain a deeper understanding of user behavior on their website. Its ability to provide detailed insights into where users click, move, and scroll makes it an essential tool for optimizing web page design and improving user experience. While it has some limitations, such as potential information overload and limited features in the free version, its benefits far outweigh these drawbacks, making it a top choice for website owners and marketers.
5. Best Heatmap Tool For Small Business: Zoho PageSense
Best heat map tool for small businesses is Zoho PageSense. It is a budget-friendly platform that helps small businesses improve website performance and increase visitor engagement.
Functionalities
Zoho PageSense tracks website activity and reveals visitor behavior. It includes tools for measuring key metrics and identifying areas for improvement.
Ease of Use
The interface is simple and accessible, making it suitable for teams without technical backgrounds.
Data Analysis
When used with Zoho Analytics, PageSense provides insights into visitor behavior. These insights support website personalization and conversion optimization.
Integrations
Zoho PageSense integrates with other tools, especially within the Zoho ecosystem. These integrations streamline data sharing and analysis.
Price
Plans start at €12 per month for up to 10,000 visitors. Pricing adjusts based on traffic volume. A 15-day free trial is available for testing.

Pros of Zoho PageSense
- Advanced Heatmap Tools: Provides detailed heatmaps, showing how visitors interact with the website and page elements, including attention and scroll maps.
- Affordable Pricing: Zoho PageSense offers competitively-priced plans that cater to small businesses and startups, ensuring they can access comprehensive heatmap tools without breaking the bank.
- No-Code Integration: Easy to set up without technical expertise, ensuring a user-friendly experience for small business owners.
- A/B Testing and Personalization: Facilitates A/B testing for optimizing conversions and allows customization of website experiences based on visitor data.
Cons of Zoho PageSense
- Dependence on Zoho Ecosystem: Maximum benefits are realized when used in conjunction with other Zoho products, which might be limiting for users not fully invested in the Zoho ecosystem.
- Limited Free Version: The free trial may not include all advanced features, necessitating an upgrade for full functionality.
Zoho PageSense stands out as an optimal choice for small businesses seeking to enhance their website’s performance and user experience. Its robust analytics, user-friendly interface, and commitment to privacy make it a valuable tool for businesses aiming to understand and optimize their online presence. While it presents a learning curve and works best within the Zoho ecosystem, its benefits in driving conversions and personalizing visitor experiences are undeniable.
6. Best Heatmap Tool For Ecommerce: Lucky Orange
Best heatmapping tool for ecommerce is Lucky Orange. It provides options that help improve user experience, optimize conversions, and monitor customer behavior.
Functionalities
Lucky Orange includes dynamic heatmaps, session recordings, and funnel analysis – all essential for evaluating online store performance.
Easy to Use
The platform is simple to navigate, making it accessible for ecommerce teams without technical backgrounds.
Data Analysis
Lucky Orange tracks user activity and highlights issues in the conversion process. It also offers form analytics to identify where users drop off.
Integrations
The tool connects with select ecommerce platforms. Additional integrations are available through Zapier.
Price
Pricing ranges from $0 to $720 per month, based on traffic and features. A free trial and enterprise plans are available.

Pros of Lucky Orange
- Dynamic Heatmapping: Lucky Orange offers comprehensive analytics for clicking and scrolling around forms, menus, and pop-ups.
- Element Analytics and Segmentation: This feature lets you study specific webpage elements like buttons, images, or forms, and see user interaction with them. It also lets you filter heatmap data by user attributes like device type or traffic source.
- Shareable Screenshots: You can share heatmap data with your teammates using a download button.
- Real-time Data: It provides real-time analytics, allowing for immediate action and decision-making.
Cons of Lucky Orange
- Initial User Difficulty: It might take some time for beginners to familiarize themselves with all the features and effectively utilize them.
- Short Data Storage: Lucky Orange retains user interaction data for a limited period only, which might not be sufficient for businesses that require long-term data analysis.
Lucky Orange stands out as a powerful tool for ecommerce businesses seeking to enhance their online customer experience and boost conversions. Its comprehensive heatmap features, user-friendly interface, and real-time data capabilities make it a valuable asset. However, considerations around cost and the learning curve for new users should be taken into account.
7. Best Heatmap Tool For Real Time Tracking: Mouseflow
Best heat map software for real time tracking is Mouseflow. It helps teams monitor interactions as they happen, supporting immediate optimization of user experience and conversions.
Functionalities
Mouseflow includes six types of heatmaps: Click, Scroll, Attention, Movement, Geo, and Live. These features help track how users engage with specific page elements.
Easy to Use
The interface is simple and intuitive, making it suitable for marketers, analysts, product managers, and UX or CRO professionals.
Data Analysis
Mouseflow offers a clear analytics dashboard and tools for advanced user behavior analysis. These insights support performance improvements and UX decisions.
Integrations
Mouseflow integrates with 50 tools, covering analytics, marketing, and development platforms.
Price
Plans range from €0 to €399 per month. Enterprise solutions are available with custom pricing. There is a 14-day free trial.

Pros of Mouseflow
- User Interaction Visualization: Mouseflow records 100% of users and pages, offering detailed insights into user behavior.
- Analysis of Past User Behavior: Mouseflow enables you to examine user behavior retrospectively (for a period of 3-12 months) without requiring any manual configuration.
- 6 Types of Maps: There are 6 types of heatmaps, including one for real-time tracking: Click, Scroll, Attention, Movement, Geo, Live.
- Friction Score: Identify users who are least satisfied and focus on analyzing those heatmaps that have the greatest impact.
Cons of Mouseflow
- Can Be Expensive: Some users may find that Mouseflow lacks certain features or is costly compared to other heatmap tools.
- Complexity for Beginners: Beginners may find the platform challenging to use due to its complexity.
Mouseflow offers a wide array of features that cater to various professional needs. Its ability to record and analyze every user interaction makes it invaluable for optimizing website performance and enhancing user experience. While it presents challenges in terms of complexity and data management, the benefits it offers in understanding and improving user interactions are substantial.
8. Best AI Heatmap Tool: Attention Insight
Best AI heatmap tool is Attention Insight. The platform uses AI-powered predictive eye-tracking to create heatmaps. It helps improve design performance by revealing how users are likely to engage with visual content before launch.
Functionalities
The platform generates AI heatmaps, attention percentages, focus maps, and clarity scores. These features support data-backed design decisions.
Easy to Use
The interface is simple. Analytics are generated in under a minute, allowing quick validation of design concepts.
Data Analysis
Attention Insight delivers results with 90–96% accuracy, based on psychological research. The tool supports early-stage testing without user surveys or live traffic.
Integrations
It integrates with major design platforms, streamlining the design review and optimization process.
Price
Pricing ranges from $24 to $324 per month. A 14-day free trial is available for testing.

Pros of Attention Insight
- Eye-Tracking Capabilities: Attention Insight leverages AI-powered predictive eye-tracking technology to generate accurate heat maps.
- Insights on Design Concepts: Provides quick feedback on design concepts, aiding in optimization before launch.
- Highly Accurate Analytics: Attention Insight offers highly precise data analysis, grounded in psychological research.
Cons of Attention Insight
- Based on Predictions: Dependence on AI predictions, which may not always align with actual user behavior.
- Potential Overreliance on AI: Users might overly depend on AI suggestions, potentially overlooking unique aspects of their website that require human judgment.
- Limited Scope of Analysis: Limited to visual attention analysis, may not cover all aspects of user experience.
Attention Insight is a top AI heatmap tool offering predictive eye-tracking technology for instant AI heatmaps, enhancing conversions by understanding user engagement. However, it’s important to recognize that AI predictions may not always reflect actual user behavior. Its analysis is limited to visual attention and may not account for other user experience facets.
How Heatmap Tools Improve Landing Page Performance?
Heatmap tools enhance landing page performance by revealing how users interact with content – where they click, how far they scroll, and which elements they focus on. This behavioral data helps identify friction points and align page design with actual user intent.
For instance, if a key call-to-action is being ignored, a heatmap can show whether it’s placed too low or overshadowed by other elements. Scroll maps can indicate whether users reach important content or leave the page early. With this information, marketers can adjust layout, simplify navigation, and prioritize content placement.
By replacing guesswork with visual evidence, heatmaps support smarter design decisions and more effective testing. They help improve usability and increase conversions through continuous, informed adjustments.
Stop guessing. Start seeing exactly where users click, scroll, and drop off—and optimize your landing pages like a pro.
FAQ For Heatmap Software
This section will answer some common queries about heatmaps and conversion rate optimization, giving insights into the various applications of user engagement tracking software.
What is a heatmap?
A heatmap is a visual tool that shows how users interact with a website or app. It uses color gradients to highlight areas of high and low activity. Warmer colors like red and orange indicate more interaction, while cooler colors like blue and green indicate less.
Heatmaps can track clicks, scrolls, and mouse movements, revealing which parts of a page attract the most attention.
For example, if 70% of users click on one product category while only 10% click on another, the data suggests where user interest is concentrated. This helps businesses prioritize content and adjust marketing strategies.
By analyzing heatmap data, teams can improve user experience, refine page layouts, and increase conversions.
Build smarter with real user data. Landingi shows what works—and helps you optimize it. Try it free.
What is conversion rate optimization?
Conversion rate optimization (CRO) is the process of increasing the percentage of website or app visitors who complete a specific action – such as making a purchase, signing up for a newsletter, or submitting a form.
CRO involves adjusting page design, content, and user experience to guide more users toward taking that action.
Tools like heatmaps help identify which elements users engage with or ignore. These insights support changes that improve usability and drive more conversions, ultimately boosting business results.
What is a conversion optimization tool?
A conversion optimization tool is software that helps increase the percentage of website visitors who complete a specific action, such as purchasing a product or filling out a form.
These tools include A/B testing platforms, heatmap software, user feedback tools, web analytics, traffic analysis tools, and form analytics.
By using these tools, businesses can better understand user behavior, identify friction points, and make data-driven changes that improve conversion rates.
Stop guessing. A/B test headlines, CTAs, and more in Landingi—free to start.
What is a heatmap software?
Heatmap software is a tool that visually displays how users interact with a webpage by using color-coded overlays. It highlights which areas receive the most or least engagement, helping businesses identify what works and what needs improvement.
This insight supports better design decisions, improved user experience, and higher conversion rates.
What type of data is best visualized with a heatmap?
Heatmaps are best for visualizing user interaction data. This includes:
- Where users click
- How far they scroll
- Which elements they engage with most
These visual patterns help businesses understand user behavior and adjust their website to better meet visitor needs.
What are the benefits of using heatmaps?
Heatmaps help businesses understand how users interact with a webpage. They make complex data easy to interpret by using visual cues to show engagement levels.
Key benefits include:
- Identifying user behavior patterns
- Detecting underperforming areas on a page
- Spotting where users drop off
- Supporting data-driven design improvements
These insights lead to a better user experience and higher conversion rates.
Not all clicks are created equal. Discover how far users scroll and what grabs their attention—try EventTracker now.
What are the different types of heatmaps?
There are three primary types of heatmaps: click heatmaps, scroll heatmaps, and move heatmaps. Click heatmaps show where users click on a webpage, helping identify which elements attract the most attention or may be misleading. Scroll heatmaps reveal how far down the page users scroll, which indicates whether key content is placed too low to be seen. Move heatmaps track where users move their cursor, offering clues about how they navigate and what areas they visually focus on.
Each type provides a different perspective on user behavior, allowing businesses to make targeted improvements to layout, content positioning, and overall usability.
Can Excel make a heat map?
Yes, Excel can generate heatmaps using conditional formatting. This feature helps visualize patterns in spreadsheet data by applying color gradients to cells based on value. However, Excel heatmaps are limited to static data and do not provide insights into user behavior on websites. For behavioral analysis, dedicated heatmap software is more effective.
What to look for while choosing heatmap software?
When selecting heatmap software, it’s important to evaluate its ease of use, the accuracy of the data it provides, and the types of heatmaps it supports. Consider whether it integrates well with your existing tools and whether it offers features tailored to your goals, such as session recordings or A/B testing. Cost is also a key factor, along with the quality of customer support and the vendor’s overall reputation. A strong heatmap tool delivers reliable insights, offers essential features, and fits your budget.
What to avoid while choosing heatmap software?
Avoid heatmap tools that are difficult to use, provide inconsistent or inaccurate data, or lack the specific heatmap types your team needs. Stay away from platforms with high costs that don’t align with the features offered or those with poor customer support. Choosing the wrong tool can lead to wasted time and limited insight, so it’s important to match the software to your technical skills, business goals, and budget.
Choose the Right Heatmap Tool to Optimize Your Landing Pages
Selecting the right heatmap tool can directly impact landing page performance, user engagement, and business outcomes. Each of the tools mentioned offers distinct strengths. For example, Microsoft Clarity stands out for its cost-effectiveness, while Attention Insight provides AI-powered predictions for visual engagement.
It’s essential to choose a solution aligned with your business goals. For landing page optimization, consider Landingi, a conversion-focused platform with built-in A/B testing and event tracking. Its EventTracker feature monitors user actions such as button clicks, scroll depth, and payment events, and integrates with Google Analytics 4 for streamlined data analysis. This enables you to pinpoint friction points and improve the user experience.
An upcoming update will introduce a visual event map, giving you a clear view of user interactions across your landing pages.