A Landing Page KPI (Key Performance Indicator) is a measurable value that helps determine how well a landing page meets its objectives. These metrics provide insights into user engagement, conversion rates, and overall landing page performance, enabling marketers to optimize their strategies for better results.
Landing page metrics are crucial for understanding and improving the performance of your campaigns. They encompass various aspects, from how long visitors stay on your page to how many of them complete the desired action. According to Email Vendor Selection statistics, a staggering 82.2% of landing pages require optimization – yet the optimization should never be guesswork; it requires a data-based approach that helps identify improving areas. By regularly monitoring landing page KPIs, marketers can identify strengths and weaknesses in their landing pages and make data-driven decisions to enhance effectiveness. That’s the real power of landing page performance tracking.
In this article, we’ll explore the key landing page KPIs you should measure to assess success. We’ll delve into common metrics such as conversion rates, bounce rates, and average time on page, providing a comprehensive overview of what each metric indicates and how it can inform your optimization efforts.
Are you ready to turn your landing page into a powerful tool that provides excellent campaign results? Read on – by the end, you’ll have a clear understanding of how to leverage landing page KPIs to boost your marketing performance and achieve your campaign goals.
What Is KPI (Key Performance Indicator)?
Key Performance Indicator (KPI) is a specific, measurable value that marketers use to evaluate the success of their marketing strategies and campaigns. In short, it’s a way to track progress toward a goal, such as brand awareness, lead generation, customer engagement, and sales growth. By monitoring these indicators, marketers can make data-driven decisions to optimize their efforts and improve overall performance.
Marketing KPIs vary depending on a campaign or strategy’s specific goals. Common KPIs include metrics like website traffic, conversion rates, cost per lead, customer acquisition cost, and return on investment (ROI). For instance, a digital marketing campaign might track KPIs such as click-through rates (CTR) for email marketing, social media engagement rates, or the number of qualified leads generated from a paid advertising campaign.
Effective marketing KPIs should be closely aligned with business objectives and provide clear, actionable insights. They must be regularly monitored and analyzed to ensure marketing activities are on track and identify areas for improvement. Marketers can better understand their audience, refine their strategies, and ultimately drive more successful marketing outcomes by focusing on relevant KPIs.
What Is Landing Page KPI?
A landing page key performance indicator (KPI) is defined as a value that demonstrates how effectively your landing page achieves key business purposes. Organizations use KPIs in many ways to evaluate their progress toward achieving targets. Knowing the landing page performance metrics may influence the ability to use page potential most.
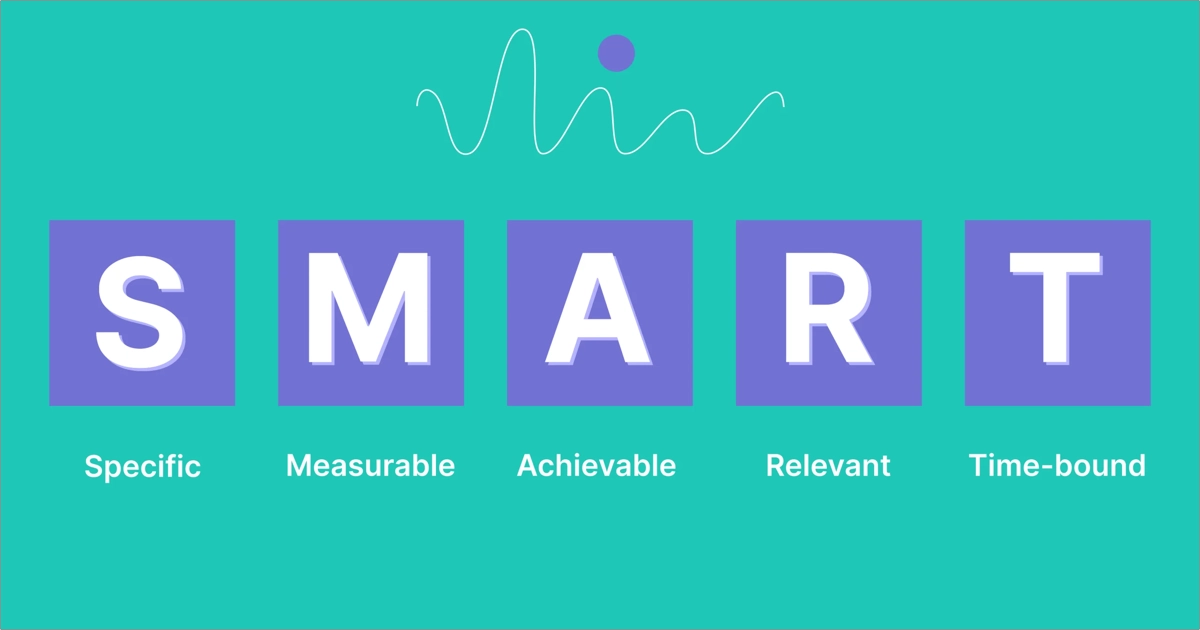
One way to evaluate a KPI’s relevance is to use the SMART criteria:
- Is your goal specific?
- Can you measure the progress?
- Is the goal realistically achievable?
- Is it relevant to the success of your landing page?
- What is the timeline for achieving this goal?
What Is the Most Important Landing Page KPI?
The most important landing page KPI is conversion rate. Conversion rate refers to the percentage of visitors who take the desired action on your landing page.

Every landing page needs a call to action (CTA) – an incentive that leads visitors to make a specific move. This action can vary depending on the goal of the landing page, but some common examples include:
- Filling out a form to download an ebook or subscribe to a newsletter
- Making a purchase
- Signing up for a free trial
The conversion rate is a primary landing page metric that tells you how effectively your landing page achieves its specific objective. A high conversion rate means that your landing page convinces visitors to take action, while a low conversion rate indicates room for improvement.
There are two reasons why conversion rate is the most important metric in landing page tracking:
- Focuses on the ultimate goal – since landing pages are designed with a specific conversion goal in mind, conversion rate directly measures how well the page is achieving that goal.
- Provides actionable insights – analyzing conversion rate can help you identify areas where your landing page is falling.
9 Common Landing Page KPIs
Learn about 9 common KPIs for landing pages that every marketer should track and how they can help you evaluate the success of your site. Evaluating landing page performance must be done through proper analysis, which includes not only individual metrics, but also their correlated impact on performance – find out how to optimize a landing page based on the data.
1. Landing Page Views
The first key landing page metric, after conversion rate, is landing page views. It’s also the most common factor that marketers track – the number of page views in the measured timeframe. Landing page views are the foundation for all other performance metrics, providing the raw data from which you can gain valuable insights and fuel continuous optimization efforts.
Landing page views are a basic metric that allows for the following:
- Establishing the baseline for measuring all other KPIs – you can’t calculate conversion rates, bounce rates, or time on page without first understanding the total volume of visitors who have interacted with the page.
- Gauging reach and awareness – a healthy number of landing page views indicates a successful reach of your target audience. It suggests that your marketing campaigns, organic search presence, or other traffic acquisition strategies effectively drive users to the page.
- Identifying traffic sources – by analyzing the sources of your landing page views (organic search, social media referrals, paid advertising clicks, etc.), you gain crucial insights into which marketing channels are most effective at attracting potential customers. This allows for targeted optimization of your marketing efforts.
- Contextualizing conversion rates – conversion rates, while undeniably crucial, can be misleading when viewed in isolation. A low conversion rate on a landing page with minimal views might not be as concerning as a similar rate on a page with high traffic. Landing page views provide context to conversion rates, helping you assess their true significance.
It’s important to remember that all landing page KPIs work together to paint a complete picture. By analyzing these metrics in tandem, you gain a comprehensive understanding of user behavior on the landing page and can identify areas for improvement. In essence, landing page views are the gateway to a successful landing page optimization journey. They provide the initial spark that ignites further analysis and ultimately leads to a landing page that converts at its full potential.
If you use Google Analytics to track your landing page KPIs, you should know the difference between pageviews and unique pageviews metrics. A pageview is counted as whenever a visitor lands on your landing page or reloads the page. Unique Pageview simply puts together all page views that are from the same person and are related to the same page or session. Go to our Help Center to read about landing page visits, pageviews, and sessions.

2. Bounce Rate
The second key landing page metric is bounce rate, the percentage of visitors who view a landing page and leave without taking another action. Bounce rate emerges as a critical indicator of user engagement, and your goal is to minimize this indicator as much as possible. It grows when a visitor leaves a landing page by:
- clicking “back”;
- closing the browser/tab;
- staying inactive for more than 30 minutes;
- typing in a new address without interacting with the page;
- clicking on an outbound link.
A high bounce rate can signal a potential mismatch between the landing page’s content and the users’ expectations when they arrive there. It suggests that the page might not address the visitor’s search intent or lack clarity in its value proposition. The bounce rate can also indicate navigation issues on your landing page. Users who cannot easily find the desired information or complete the intended action are likelier to leave without engaging further. This highlights the importance of clear calls to action (CTAs), an intuitive page structure, and a user-friendly design.
You should also track the landing page bounce rate on mobile devices. High results could point to optimization problems. If the landing page is not responsive or displays poorly on smaller screens, this can lead to frustration and a quick departure for mobile users.
By understanding the underlying reasons behind a high bounce rate, you can implement the following targeted optimization strategies:
- Craft compelling content to ensure your landing page copy is clear, concise, and directly addresses the visitor’s needs.
- Prioritize user experience to provide a seamless user experience by making navigation intuitive, calls to action prominent, and the overall design visually appealing.
- Incorporate mobile responsiveness to guarantee your landing page renders flawlessly across all devices, particularly smartphones and tablets.
Addressing these factors can significantly reduce bounce rates and improve visitors’ overall engagement on your landing page. Remember, a lower bounce rate often translates into a higher conversion rate, which signifies that users find value and take the desired actions on your landing page.
3. Average Time on Page
The third key landing page metric is the average time on page, which reflects the average duration users spend actively interacting with the information presented. Analyzing this metric provides valuable insights into the effectiveness of your landing page in capturing and retaining user interest beyond a cursory look.
A higher average time on page indicates that visitors find your landing page content informative and sufficiently comprehensive. This suggests the content effectively addresses their needs and compels them to delve deeper. It signifies a successful alignment between the landing page’s message and the user’s search intent. Landing pages often serve as crucial points in a user’s decision-making process. A longer time spent on a page implies that visitors carefully consider the information presented. They might be weighing the value proposition, exploring product features, or reading testimonials before taking the desired action. Such extended engagement signifies a thoughtful approach to decision-making, which can ultimately lead to higher conversion rates.
Conversely, an exceptionally low average time on page, particularly when coupled with a high bounce rate, could suggest navigation problems. Users might struggle to find the information they seek or encounter usability issues that prompt them to leave quickly. A low average time on page, absent a high conversion rate, might indicate that visitors are not finding the value proposition clear or compelling enough to warrant further exploration.
However, your landing page’s indirect goal is to engage users with the value proposition, directing them through immersive content to CTA. Once you understand the reasons that affect the low average time on page, you can implement the following optimization strategies to improve this key metric:
- Craft content that engages to ensure your landing page copy is informative, interesting, and directly addresses the visitor’s pain points. Consider incorporating relevant visuals, statistics, or case studies to enhance content depth and credibility.
- Prioritize clarity and focus to maintain a clear and concise message throughout the landing page. Avoid overwhelming visitors with excessive information, and ensure a singular call to action (CTA) stands out prominently, guiding users towards the desired action.
- Optimize for user experience to provide a seamless user experience. Make navigation intuitive and the overall design visually appealing. Integrate high-quality visuals and ensure the page loads quickly and functions flawlessly across all devices.
By implementing these optimizations, you can encourage users to engage more with your landing page content. This deeper engagement can lead to a more informed decision-making process and ultimately culminate in higher conversion rates. Remember, when analyzed in conjunction with other metrics, average time on page paints a clearer picture of user behavior and empowers data-driven optimization for landing page success.
4. Traffic Source
The fourth key landing page metric is traffic source, telling you which marketing campaigns are working and which are no longer worth investing in. That, in turn, will help you decide which channel you should concentrate on to increase the number of landing page conversions. It unveils the specific marketing channels – organic search, social media campaigns, paid advertising initiatives, etc. – that are driving visitors to your landing page. Analyzing traffic sources empowers you to make informed decisions regarding marketing resource allocation and ultimately optimize your landing page for the channels providing the highest return on investment (ROI).
By identifying the sources of your landing page traffic, you can assess the effectiveness of your marketing campaigns. Traffic volume originating from a specific channel can indicate the reach and engagement generated by that campaign. Analyzing conversion rates alongside traffic volume provides a more holistic picture of campaign success.
Understanding which marketing channels drive the most qualified traffic and conversions allows you to allocate resources strategically. You can prioritize channels with a proven track record of delivering high-converting visitors, and potentially scale back investments in underperforming channels.
Moreover, knowing traffic sources empowers you to tailor your landing page content and messaging for specific audiences. For instance, users arriving from a social media ad might require a more concise value proposition than those who found the page through an organic search with more informational intent.
How can you drive more traffic to your landing page?
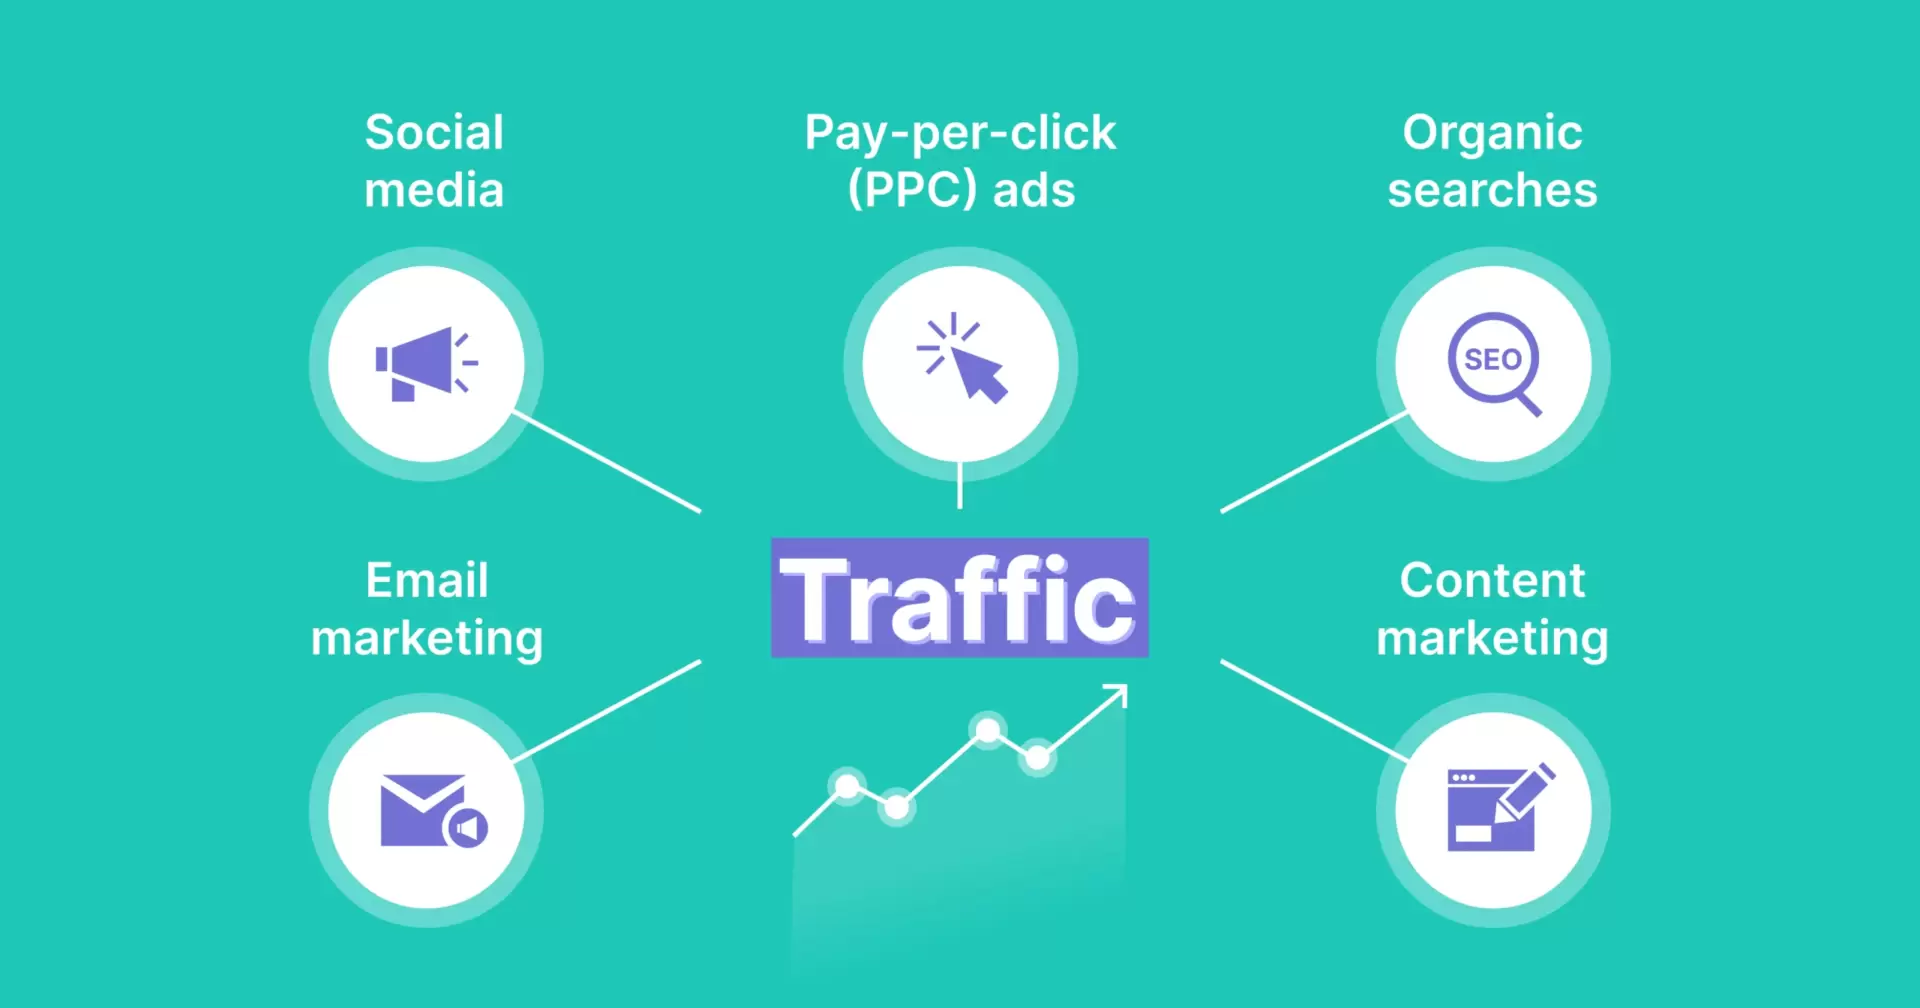
To drive more traffic to your landing page, leverage the best landing page tool –Landingi, and implement optimization strategies thanks to which you can squeeze the most from your marketing channels, such as PPC ads, social media, organic searches, email marketing, or content marketing.
Your optimization efforts should focus on specific areas, depending on a marketing campaign, as follows:
- Organic Search – for visitors arriving from organic searches, ensure your landing page content aligns with relevant keywords and search intent. Optimize for search engines by incorporating meta descriptions and title tags strategically.
- Social Media – for traffic originating from social media platforms, craft concise and visually appealing landing pages that resonate with the social media audience’s expectations. Utilize strong calls to action (CTAs) optimized for mobile devices.
- Paid Advertising – for visitors arriving from paid advertising campaigns, ensure your landing page content seamlessly aligns with the message and value proposition presented in the ad itself. Maintain a clear call to action that directly relates to the advertised offer.
- Email Marketing – for visitors coming from email campaigns, ensure the landing page reinforces the email’s message and provides a seamless transition. Use personalized content where possible and keep the design consistent with the email’s visual style. Make sure the CTA is prominent and aligned with the email’s call to action.
- Content Marketing – for traffic generated from content marketing efforts, such as blog posts or articles, ensure the landing page offers additional value and complements the content. Provide clear, contextual CTAs that encourage further engagement, such as downloading a related eBook, signing up for a webinar, or accessing exclusive content.
The best you can do is create a separate landing page for each digital marketing campaign. While it may seem time-consuming, there are professional tools, like Landingi, that can help you craft, monitor, and optimize your landing pages to achieve the best results.
Starting from landing page creation, the platform offers over 400 customizable templates and simplifies the process with AI landing page features. Thanks to them, you can generate engaging content for the entire landing page, fine-tune visuals, and improve SEO with just a few clicks. Moreover, Landingi supports 29 languages, allowing you to create multi-language pages and reach target audiences worldwide.
You can leverage the A/B testing tool to experiment with various page versions and find the best-performing one, providing the most traffic, which is easier thanks to the EventTracker tool. It allows you to monitor landing page events and track user behavior without complex external software. You have access to all data presented clearly in the Landingi Dashboard, which simplifies its analysis and allows you to implement data-driven optimizations. Then, employing a data-driven approach that leverages traffic source analysis, you can optimize your landing page for the marketing channels that generate the most qualified leads and ultimately drive higher conversion rates.

5. Form Abandonment
The fifth key landing page metric to follow is form abandonment, the percentage of visitors who fill out the required information but leave the page before finishing. Beyond core metrics like conversion and bounce rate, the form abandonment rate is a critical indicator of potential friction within your landing page’s conversion funnel. Analysis of this indicator sheds light on potential obstacles that may prevent users from completing the desired action.
A high form abandonment rate can signify usability issues within the form itself. This could encompass overly complex layouts, excessive form fields, unclear instructions, or technical glitches preventing successful submission. Lengthy forms can be daunting and discourage visitors from completing them. Analyzing form abandonment rates in conjunction with the number of form fields can help you determine if streamlining the form is necessary.
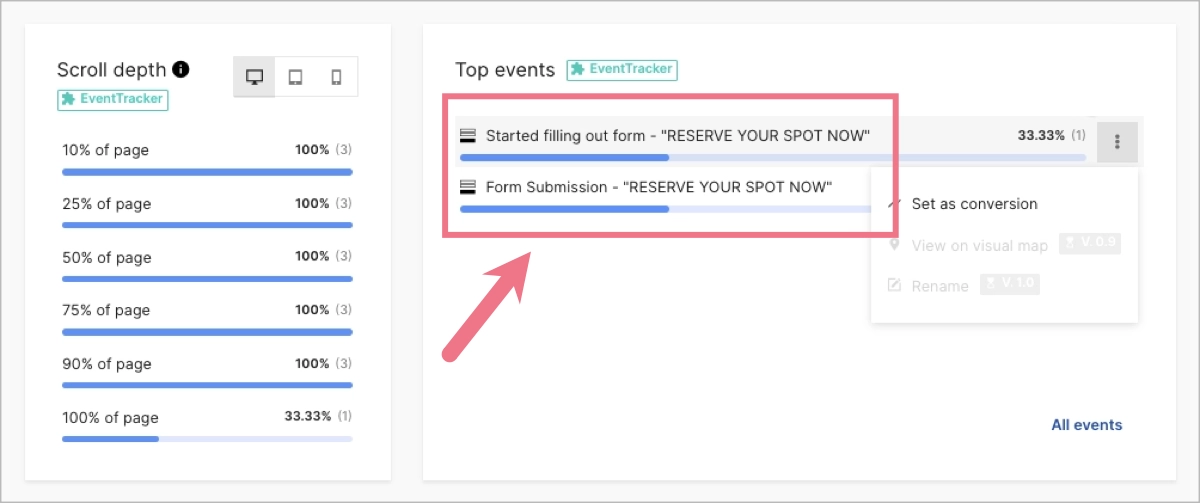
This KPI indicates the success of your marketing campaign. Your objective is to keep it as low as possible, but when it grows, it might suggest that visitors are unsure whether the value proposition on your landing page justifies the effort required to complete the form. It’s a clear signal for you to implement optimizations. Yet, don’t rely on guesswork – use advanced analytics tools, like EventTracker, to check form initiations, submissions, and errors, analyze user behavior, and find out which form elements generate the most friction. This will allow you to adjust them to user expectations and decrease the form abandonment rate.
Once you understand the reasons behind the high abandonment rate for your form, you should focus on proven optimization strategies, as follows:
- Simplify form design – prioritize a user-friendly form layout with clear labels and intuitive navigation. Consider utilizing progress bars or completion indicators to enhance user experience.
- Streamline form fields – minimize the number of required fields to the absolute essentials.
- Offer a clear value proposition – emphasize the benefits of form submission on your landing page.
- Use A/B test variations – experiment with different form designs, field layouts, and value propositions to identify what resonates best with your target audience. Utilize A/B testing methodologies to determine which variations yield the lowest form abandonment rates.
6. Conversion Goal
The sixth key landing page metric is the conversion goal. The conversion goal is a specific action you want visitors to take once they arrive on the page. It represents the desired outcome that aligns with your overall business objectives. Understanding and defining the conversion goal is essential for the following reasons:
- Focused optimization – a clearly defined conversion goal provides a clear direction for optimization efforts. By understanding the desired outcome, you can tailor the landing page’s content, design, and calls to action to maximize the likelihood of achieving that goal.
- Key Performance Indicator (KPI) alignment – the conversion goal serves as a crucial KPI, enabling you to measure the landing page’s effectiveness in driving desired actions. Tracking and analyzing conversion rates against the goal provides actionable insights for improvement.
- Revenue generation – ultimately, the conversion goal should contribute to revenue generation or lead generation. You can directly correlate landing page performance to business outcomes by setting clear conversion goals.
Your landing page conversion goals can be connected with purchasing or lead generation objectives, depending on your campaign assumptions, and can be expressed by the following actions:
- Making a purchase
- Signing up for a newsletter
- Downloading an ebook
- Requesting a quote
- Scheduling a consultation
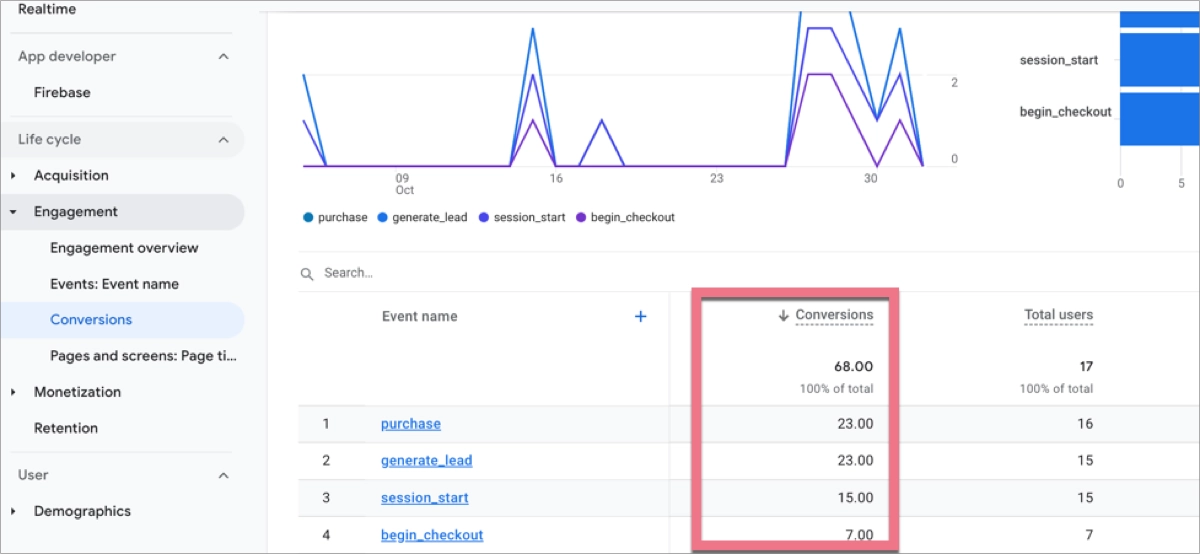
By determining clear, measurable, and achievable conversion goals, you can effectively evaluate landing page performance, optimize for success, and, ultimately, drive desired outcomes. Setting up your landing page conversion goals in Google Analytics can help you keep track of conversions and see how their rates fluctuate and whether they are close to the target.
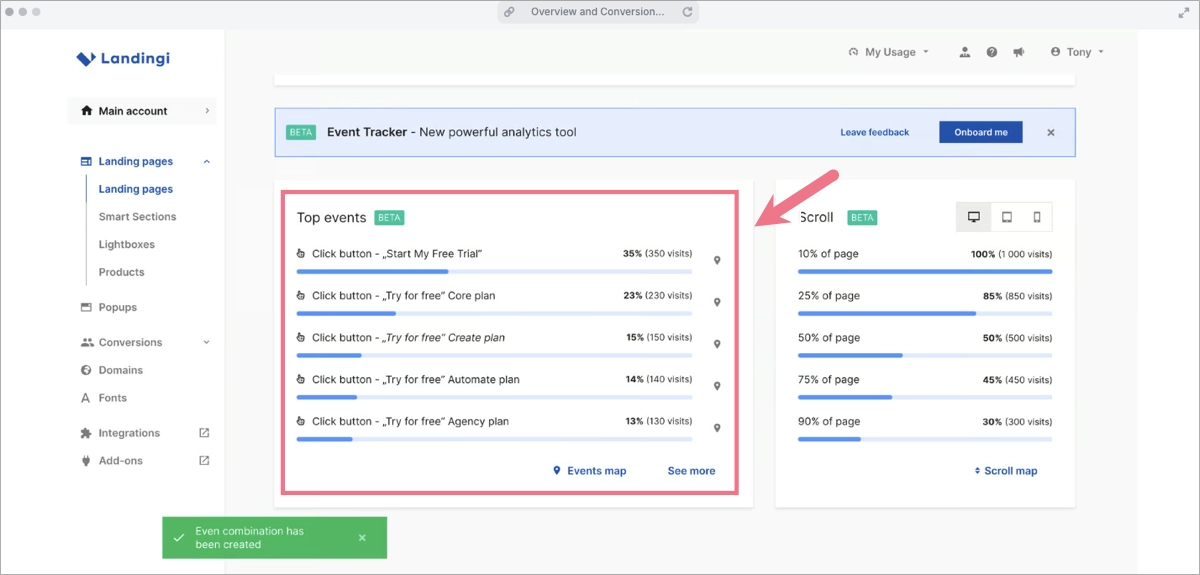
If you’re not in common with GA, keep a little patience and be ready for another facilitation from Landingi – EventTracker is a continuously evolving analytics tool, and its new features, soon available for everyone, will allow you to track conversion goals without any external software.
7. Return and New Visitors
The seventh key landing page metric to track is return and new visitors. As understanding the composition of your landing page traffic is crucial for optimizing performance and informing strategic decisions, distinguishing between return visitors and new visitors provides valuable insights into user behavior, engagement, and the efficacy of acquisition strategies.
Return visitors are users who have previously visited your landing page. Their presence indicates a level of interest or engagement generated by the initial visit. Tracking return visitor metrics can help assess the effectiveness of your content, calls to action, and overall user experience in fostering repeat engagement. New Visitors are users encountering your landing page for the first time. Analyzing new visitor metrics offers insights into the success of your acquisition channels and the overall appeal of your landing page to a fresh audience.
By carefully examining the ratio of return to new visitors, you can gain a comprehensive understanding of your landing page’s performance. A high percentage of return visitors suggests that your content resonates with the target audience and encourages repeat visits. Conversely, a predominance of new visitors might indicate a need to improve engagement or explore new acquisition channels. Ultimately, the balance between return and new visitors is critical in driving long-term success and building a loyal customer base.
8. Page Load Speed
The eighth key landing page metric is page load speed, measuring the time elapsed between a user accessing a landing page and the complete rendering of its content. Even milliseconds can significantly influence user behavior, especially considering today’s fast-paced digital landscape.
Slow load times have substantial implications. They can impact growing bounce rates because users have limited patience, and slow-loading pages often lead to immediate exits. They negatively affect user experience, as frustration and dissatisfaction arise from prolonged waiting times, negatively impacting brand perception. Slow-loading pages can disrupt the user journey and hinder completing desired actions. Slow load times also poorly affect search engine rankings, as these prioritize fast-loading websites in their search results.
Conversely, a fast–loading landing page enhances user satisfaction, encourages exploration, and bolsters the likelihood of conversions. It is essential to regularly monitor page load speed and implement strategies to maintain optimal performance. Yet, Optimizing page load speed is a multifaceted endeavor that requires a holistic approach, including the following key strategies to enhance performance:
- Image optimization – use professional tools to reduce image file sizes without compromising quality. Based on image content and desired quality, choose appropriate image formats (JPEG, PNG, WebP). Implement responsive image formats to deliver optimized images for different screen sizes. Leverage lazy loading: defer loading images until they are about to enter the viewport, improving initial load time.
- Code optimization – remove unnecessary characters from HTML, CSS, and JavaScript files to reduce file size. Then, reduce HTTP requests by combining multiple CSS and JavaScript files into fewer files. Set appropriate cache headers to allow browsers to store static resources locally. Minimize external scripts and stylesheets to reduce the number of requests.
- Server optimization – distribute content across multiple servers (CDN) to reduce latency and improve load times. You can also optimize server configuration and hardware to ensure fast response times. Then, optimize database queries to minimize the server’s load.
- User experience optimization – prioritize essential content above the fold to provide immediate value to users. Leverage progressive loading and set priorities on visible content: load critical rendering path elements first to display the content quickly.
- Performance testing and monitoring – measure performance using tools like Google PageSpeed Insights, GTmetrix, or WebPageTest. Track page load speed over time to identify performance regressions.
By implementing these techniques and continuously monitoring performance, you can significantly improve your landing page’s load speed, enhance user experience, and drive higher conversion rates.
9. Scroll Depth
The ninth key landing page metric is scroll depth, which quantifies how far users scroll down a landing page. It provides valuable insights into user engagement with the content presented. By analyzing scroll depth, marketers can gauge the effectiveness of their page layout, content hierarchy, and overall user experience.
It’s another example of user engagement metrics, which can be interpreted across a spectrum, providing valuable insights into user behavior:
- Shallow scrolling (0–25%) – low scroll depth might indicate a lack of initial engagement. Users could encounter a confusing layout, irrelevant content, or a weak value proposition that fails to capture their attention.
- Mid-scroll depth (25–50%) – moderate scrolling suggests some level of user interest. Visitors might be scanning the page for specific information or browsing headlines but not necessarily delving deep into the content.
- Deep scrolling (50–75%) – high scroll depth signifies a high level of user engagement. Users actively read the content, potentially indicating that the landing page effectively addresses their needs and interests.
- Very deep scrolling (75%+) – while seemingly positive, exceptionally high scroll depth might suggest the content is too lengthy or lacks clear navigation points. Users might be scrolling extensively to find the specific information they seek.
While scroll depth provides valuable qualitative data, it’s essential to consider it in conjunction with other metrics like time on page and bounce rate to gain a comprehensive understanding of user behavior.
Once you understand which parts of your page are the most engaging, you can further optimize them for maximum efficiency in driving conversions. Still, by discovering poorly performing landing page sections, you gather valuable insights that can help you improve your page’s overall success. With the scroll depth metric, you can adjust your page to meet users’ expectations and, ultimately, improve conversion rates.
What Conversion Rate Should Be Set as a Landing Page KPI?
As a landing page KPI, you should always set a realistic conversion rate based on the industry, type of landing page, and specific campaign goals. While aiming for exceptionally high conversion rates is tempting, setting unrealistic expectations can lead to frustration and demotivation. Instead, focus on establishing a goal that is challenging yet achievable. To do so, consider the following factors:
- Industry benchmarks – check your industry conversion rate benchmarks. Understanding typical conversion rates within your industry provides a baseline for setting realistic goals. For instance, e-commerce sites might aim for a 2-5% conversion rate. SaaS pages can expect conversion between 5 and 10 %, whereas lead generation pages in B2B sectors might target a 5-10% rate.
- Historical data – if possible, analyze past performance data from your own landing pages. This historical insight helps you set a conversion rate that reflects your specific audience and previous campaigns. If your past campaigns converted at 3%, aim for incremental improvements rather than drastic changes.
- Campaign goals – align your conversion rate goals with the specific objectives of your campaign. For example, a product launch might focus on higher conversion rates compared to a brand awareness campaign. Ensure that your goals match the desired outcomes of the campaign.
- Traffic quality – consider the source and quality of your traffic. Organic traffic often converts at higher rates than paid traffic due to users’ higher intent. Similarly, traffic from targeted email campaigns may yield better conversion rates than general social media traffic.
- Landing page type – different types of landing pages have varying conversion potential. A page designed for lead capture might have a higher conversion rate than a sales page due to the lower commitment required from users. Tailor your expectations based on the type of landing page you are optimizing.
- Optimization level – pages extensively tested and optimized for user experience and relevance can achieve significantly higher conversion rates, while new or unoptimized pages may start with lower conversion rates, which can be improved over time through testing and optimization.
To determine an appropriate conversion rate KPI for your landing page, always research industry standards, analyze past landing page metrics, consider your audience and offer, and set incremental goals.
For example, if your industry average conversion rate is around 3% for e-commerce, you might set an initial KPI of 3% and aim to improve it to 4-5% through optimization. For lead generation, you might start with a 10% conversion rate KPI if that aligns with industry benchmarks and your past performance data.
By considering these factors, you can set a realistic and achievable conversion rate KPI that helps drive continuous improvement and successful outcomes for your landing page campaigns.
What Is the Average Landing Page Conversion Rate?
The average landing page conversion rate across all industries is 2.35%. However, you need to know that there’s a big difference between the best and worst performers – the top 10% have almost 5x higher conversion rates than the average. You should find information about your industry’s average conversion rate in order to set a realistic target.
Benchmarking your site’s results can help provide insights into its performance, but understanding what a “good” conversion rate looks like might be challenging. That is why you should have the big picture of your performance and look at it through multiple landing page KPIs.
Analyze Landing Page Metrics with Landingi
Creating a landing page does not end with its launch – ongoing optimization is key to success. As each landing page has a KPI, and this KPI measures performance, understanding and effectively utilizing key landing page metrics is essential for the success of any digital marketing campaign. These metrics provide valuable insights into user behavior and the overall performance of your landing pages, enabling you to make informed decisions and optimize your strategies.
Remember, the key to success lies in setting clear, achievable conversion goals and continuously refining your landing pages based on data-driven insights. Prioritize landing page optimization, leverage the power of KPIs, and use the best landing page tool – Landingi, to significantly improve your online performance and drive growth. Success is within your reach!


