Conversion funnel analysis is the process of tracking and evaluating each step in the conversion path to understand where users drop off and what prevents them from converting. In most funnels, landing pages are the point where the biggest losses happen – which makes landing page performance critical for overall results.
Even a well-designed conversion funnel won’t perform without continuous analysis. According to ZipDo, a structured funnel can increase deal win rates by 16%, but only if it’s regularly optimized based on real user behavior. Without funnel analysis, it’s impossible to identify friction points or improve landing page conversion effectively.
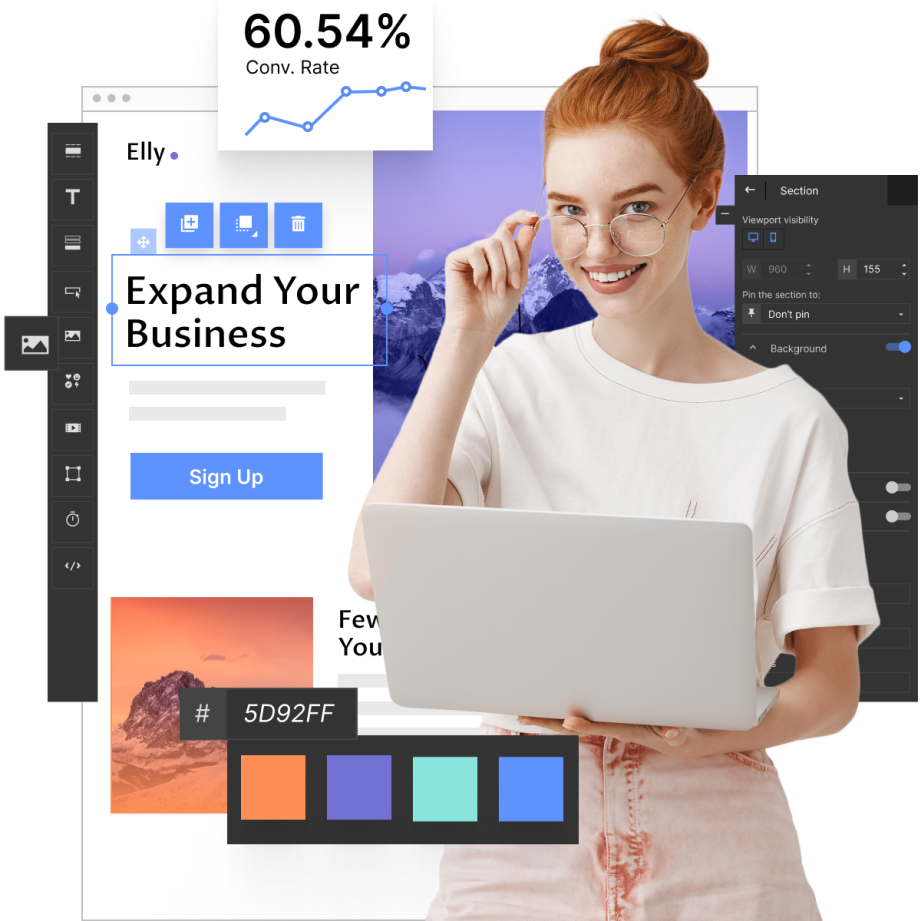
Landing pages are also where optimization can happen the fastest. Unlike traditional CMS-based websites, landing page platforms allow teams to build, test, and update pages without relying on developers. Landingi supports this process as an AI landing page operation system – combining page creation, funnel analysis, micro-conversion tracking, and continuous optimization in one workflow.
In this article, you’ll learn how to run effective conversion funnel analysis, improve landing page performance, and apply practical optimization steps across different business models.
Key Facts
- Conversion funnel analysis reveals where users drop off in the conversion path
- Landing pages are often the biggest source of funnel drop-offs
- Continuous funnel optimization is required to improve landing page conversion
- Landing page platforms enable faster testing and updates than traditional CMS

How to Run Funnel Analysis in 10 Steps?
The 10 steps below help you structure your funnel analysis process and turn raw data into actionable insights:
- Define funnel stages
- Choose analytics tool
- Identify key metrics
- Collect data
- Create a funnel visualization
- Analyze conversion rates
- Identify bottlenecks
- Find optimization areas
- Implement A/B testing
- Report insights
Each step focuses on a specific part of funnel analysis – from defining the conversion path to identifying friction points and improving landing page performance.
Step #1 Define funnel stages
Start by defining the stages of your conversion funnel and mapping the exact steps users take to complete a desired action. This creates a clear view of your conversion path and helps you understand where users move forward – and where they drop off.
Funnel stages vary depending on your business model, but a typical structure includes:
- landing on the page
- viewing product or content
- interacting with a key element (CTA click)
- starting a form or checkout
- completing the conversion
Defining these stages gives you a baseline for analysis. It allows you to track user behavior at each step and identify where your landing page performance needs improvement.
Know where your traffic stands—and design your landing page to meet them there.
Step #2 Choose analytics tool
Next, choose a funnel analysis tool that allows you to track user behavior across your entire conversion funnel and understand how users interact with your landing pages.
At this stage, the priority is proper tracking. Make sure key events are implemented – including micro-conversions such as CTA clicks, scroll depth, and form interactions. Without this data, your funnel analysis will be incomplete.
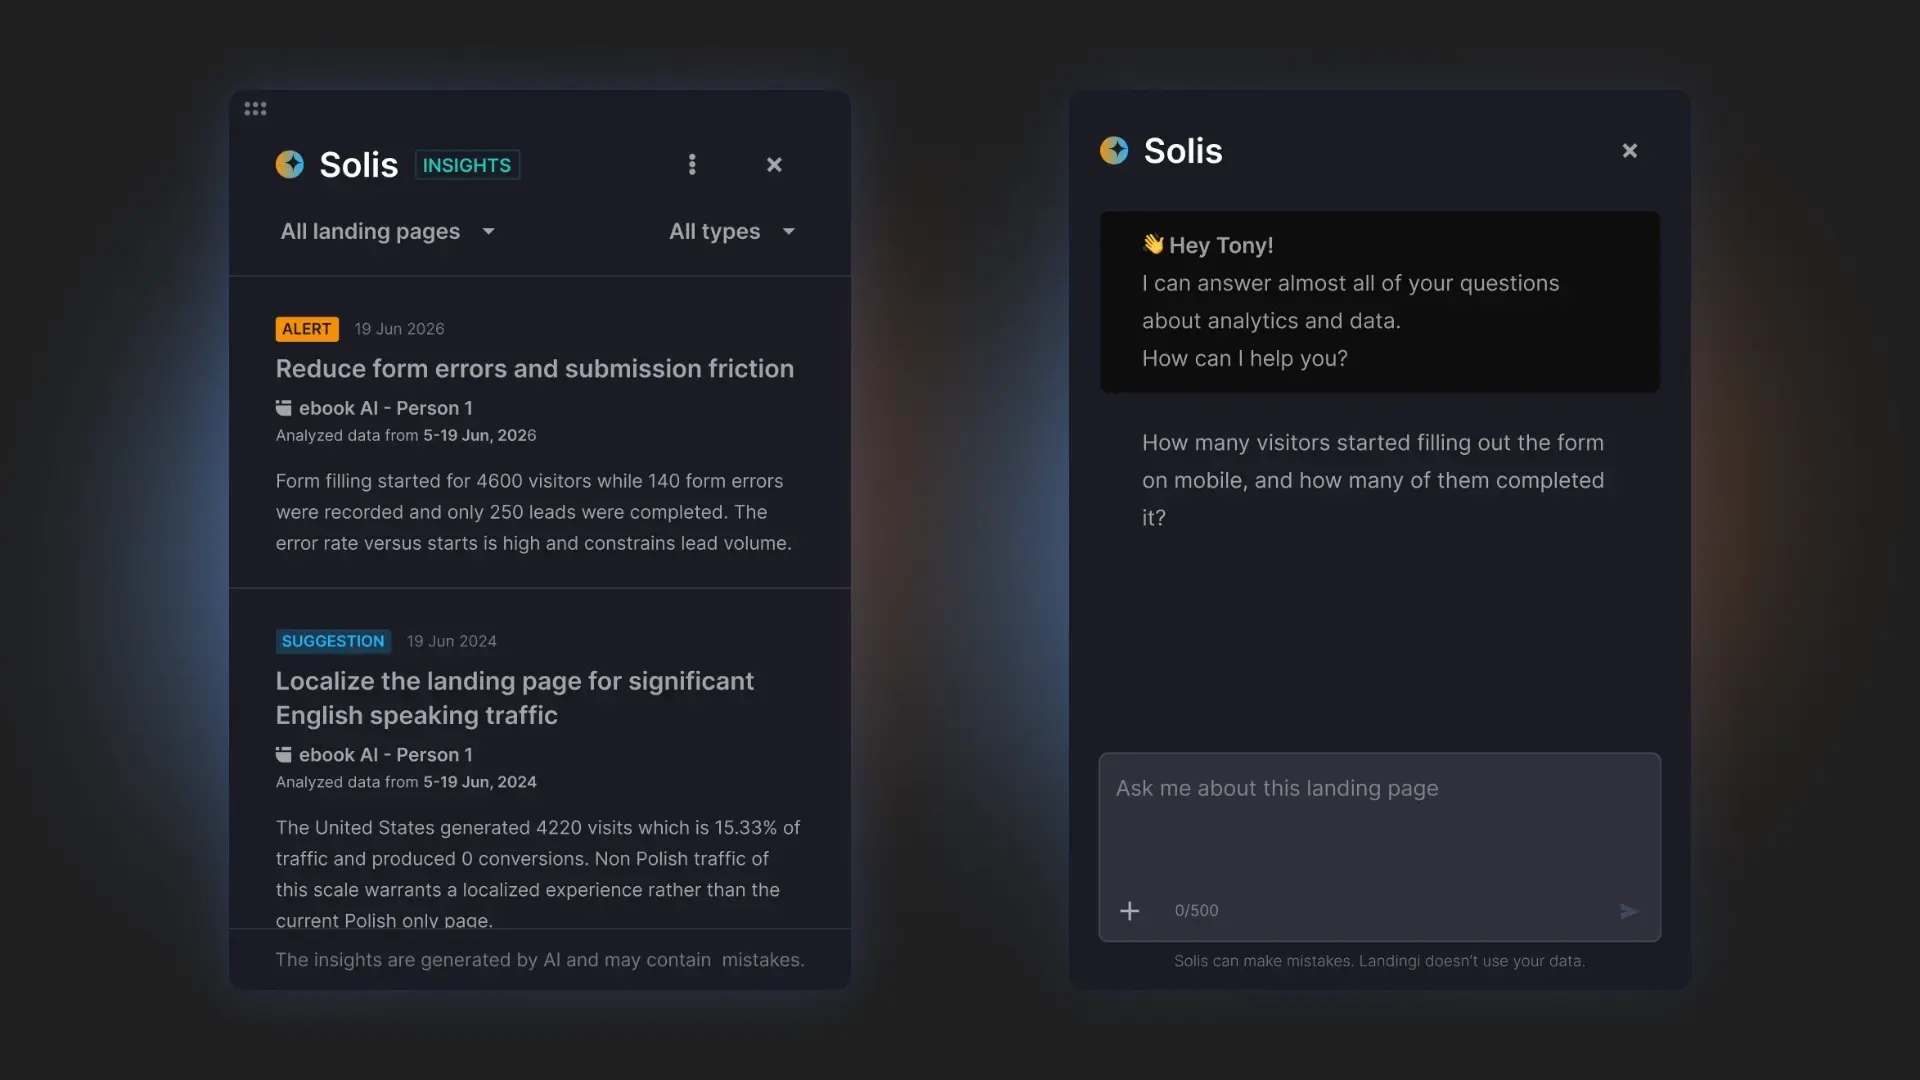
Platforms like Landingi support this process with built-in tracking through EventTracker, which collects detailed user behavior data directly on landing pages. This data can then be analyzed to identify drop-offs and friction points within the conversion path. Solis, an AI landing page optimization tool, builds on this by interpreting user behavior and highlighting areas that require optimization.
The more accurate your tracking setup, the more reliable your funnel analysis – and the easier it becomes to improve landing page performance.
Step #3 Identify key metrics
Define the key metrics for each stage of your conversion funnel. These metrics should reflect how users move through your conversion path and where drop-offs occur.
A typical funnel includes the following stages and metrics:
- landing on the page – visits (number of users entering your landing page)
- viewing content – views (how many users engage with key sections)
- interacting with the page – micro-conversions (CTA clicks and other key interactions)
- starting the process – form opens or cart additions (users initiating action)
- completing conversion – conversions (completed purchases or registrations)
Micro-conversions are especially important for landing page conversion. They help you understand user intent earlier in the funnel and identify friction points before users drop off.
Clearly defined metrics make funnel analysis actionable. Without them, it’s difficult to measure landing page performance or evaluate the impact of any optimization.
Step #4 Collect data
Once tracking is set up, start collecting data across your conversion funnel. Depending on your traffic volume, it may take time to gather enough data for meaningful funnel analysis.
Instead of focusing on daily fluctuations, look for patterns. Consistent trends across your conversion path will give you a clearer picture of user behavior and landing page performance.
Make sure you’re collecting data for all key interactions – not just final conversions. This includes clicks, scroll behavior, and form interactions, which help you understand where users engage and where they drop off.
Every click tells a story. Use EventTracker to follow user actions and turn them into valuable marketing insights.
Step #5 Create a funnel visualization
Once you’ve collected enough data, map it into a funnel visualization. This gives you a clear view of your conversion path and shows exactly where users drop off.
A funnel visualization makes patterns visible. Instead of analyzing raw numbers, you can quickly spot which stages underperform and where your landing page performance breaks down.
Most analytics tools offer built-in funnel views, but the key is not the tool itself – it’s how you read the data. Focus on large drop-offs between stages, as these are your highest-impact optimization opportunities.
A well-structured funnel turns data into direction. It shows you where to focus your efforts before making any changes.
Step #6 Analyze conversion rates
Next, analyze conversion rates at each stage of your conversion funnel to identify where users drop off and where improvements are needed.
A clear view of these patterns helps you move from raw data to actionable insights. This is where funnel analysis becomes truly useful – not just showing what happens, but helping you understand why.
In practice, this analysis can be supported by tools that interpret user behavior and surface key issues automatically. Solis analyzes funnel data in context and highlights areas that require attention, making it easier to prioritize changes and improve landing page performance.
Find out what’s blocking your conversions and what to fix next.
Step #7 Identify bottlenecks
After analyzing your funnel, focus on stages with the highest drop-off rates. These points reveal where your conversion path breaks and where optimization will have the biggest impact.
Instead of looking at the funnel as a whole, isolate specific problem areas and match them with likely causes.
Common bottlenecks include:
- Confusing navigation – unclear structure, poor mobile experience, or overly complex layouts can make it difficult for users to move forward
- Long or complex forms – too many fields or unclear inputs create friction and discourage users from completing the process
- Unclear CTAs – vague messaging, weak hierarchy, or poor placement can prevent users from taking the next step
Each bottleneck should be treated as a hypothesis. Once identified, it becomes a starting point for testing and optimization.
Step #8 Find optimization areas
Once you’ve identified bottlenecks, turn them into specific optimization actions.
Focus on the stages with the highest drop-offs and implement targeted improvements – such as simplifying CTAs, shortening forms, or aligning landing page messaging with user intent.
User behavior data helps you understand what’s actually causing friction – whether it’s unclear messaging, poor layout, or form drop-offs. For example, insights from tools like EventTracker, combined with AI-powered analysis from Solis, can help prioritize changes and reduce the time between identifying an issue and fixing it.
Step #9 Implement A/B testing
Implement A/B testing to experiment with changes on your website or application. Test variations in page design, button placement, or form layout to see how they impact conversion rates at each stage of the funnel and the final outcome.
Focus on one variable at a time and measure its impact clearly – this helps you avoid false conclusions and scale what actually works. In practice, combining A/B testing with behavioral insights and AI-supported analysis makes it easier to identify winning variations faster and apply them across your landing pages.
Step #10 Report insights
The final step is to generate reports and evaluate the impact of your optimizations. After implementing changes, analyze how they affect the conversion path and user behavior across each stage of your funnel.
Share these insights with your team, document what worked, and use the findings to plan the next iteration. Funnel analysis is not a one-time task – it’s a continuous process of testing, learning, and improving landing page performance over time.
In practice, the real advantage comes from closing the loop quickly – turning insights into actions and feeding results back into your next optimization cycle.
Analyze, optimize, and convert—build your first high-performing landing page with Landingi today!
Why Conversion Funnel Analysis Is Crucial for Landing Pages?
Conversion funnel analysis is critical for landing pages because it shows exactly where users drop off in the conversion path – and why. Since landing pages often serve as the entry point or key decision stage, even small friction points can significantly impact landing page conversion.
Funnel analysis helps you identify underperforming pages and uncover specific issues – from weak CTAs and unclear messaging to poor mobile UX or slow load times. Instead of guessing, you can base every improvement on real user behavior.
This is where landing pages have a clear advantage over traditional websites. You can test, iterate, and optimize faster – without long development cycles.
With tools like EventTracker, you can track micro-conversions, scroll depth, and user interactions, giving you a clear view of how users move through your funnel. Combined with AI-supported insights from Solis, it becomes easier to spot friction points and prioritize changes that improve performance.
3 Examples of Conversion Funnel Analysis
To better understand what conversion funnel analysis is and how optimization can impact your business, explore these 3 hypothetical examples of funnel analysis reports with detailed explanations.
#1 Conversion Funnel Analysis for e-Commerce
This example shows how conversion funnel analysis can uncover friction points and improve landing page performance in e-commerce.
For a hypothetical mid-sized online store, the conversion path looks like this: visiting the website → browsing products → adding to cart → initiating checkout → completing the purchase.
Each stage in the funnel represents a percentage of users who move forward. As shown in the example above, drop-offs occur at every step – this is normal. The goal is to identify where they are the highest and why.

In this case, the biggest drop-off happens at the checkout stage. Only 39% of users who added a product to the cart proceed to checkout, and just 27.6% of all visitors reach that step. This clearly indicates friction between the cart and checkout experience.
To improve this stage, the business could simplify the checkout flow, reduce form fields, improve trust signals, or introduce reminders for abandoned carts. Even small UX changes at this point can significantly impact the final conversion rate.
Instead of guessing what works, A/B testing allows you to validate each change and keep only the highest-performing variation. Combined with behavioral insights, this creates a repeatable process for optimizing the funnel and increasing conversions over time.
Compare variations, validate changes, and scale what actually improves your conversion rate.
#2 Conversion Funnel Analysis for SaaS Product
The SaaS conversion funnel is more complex than a typical eCommerce funnel. It’s based on David McClure’s AARRR Pirate Metrics, extended with an additional stage to better reflect long-term product growth.
It includes:
- Acquisition – users sign up for a free trial or demo
- Activation – users experience the core value
- Adoption – users begin regular usage
- Retention – users continue using and paying
- Referral – users recommend the product
- Revenue – users expand through upgrades or add-ons
Because this funnel spans multiple stages of the user lifecycle, effective conversion funnel analysis depends on tracking the right metrics at each step of the conversion path.
For example:
- Acquisition – sign-up rate, demo requests, PQLs
- Activation – onboarding completion, activation rate, time to value
- Adoption – feature adoption, usage depth and breadth
- Retention – retention rate, churn rate
- Referral – NPS, satisfaction score
- Revenue – CLV, ARPU, ARR
Turn more visitors into users, users into fans. Landingi helps you tailor landing pages to each AARRR stage.
Now, let’s look at a simplified funnel scenario:
registration → onboarding → feature adoption → first payment → feedback → subscription extension

In this example, the final conversion rate is around 1%. However, at the first payment stage, the conversion rate reaches 7%. This shows that once users experience enough value, they are significantly more likely to convert.
The biggest drop-off appears between feature adoption and first payment, which clearly points to an issue in the adoption stage. Users don’t reach value fast enough to justify paying.
To fix this, teams should focus on metrics like time to value, feature adoption, and product usage depth. This is where funnel analysis becomes actionable – you’re not optimizing blindly, but improving the exact stage that blocks revenue..
Turn insights into action. Use Landingi to build landing pages tailored for conversion!
#3 Conversion Funnel Analysis for Marketing
This example focuses on conversion funnel analysis in a marketing context, where the goal is to move users from first contact to long-term advocacy.
A marketing funnel represents the full customer journey – from awareness to loyalty – and shows how users interact with your brand at each stage.
It typically includes:
- Awareness – users discover your brand (e.g., ad clicks, content views)
- Consideration – users show interest (e.g., webinar sign-ups, downloads)
- Conversion – users take a key action (e.g., purchase, booking)
- Retention – users continue engagement (e.g., repeat purchases, subscriptions)
- Loyalty – users recommend your product (e.g., referrals, NPS)
Now, let’s look at a simplified funnel scenario:
social media ad click → webinar request → paid consultation → subscription → recommendation

In this example, the biggest drop-off happens early – between ad clicks and webinar requests. But from a business perspective, the more critical gap appears between webinar requests and paid consultations.
Why? Because this is the point where warm leads should convert into revenue.
Interestingly, later stages perform well – 40% of users who book a consultation move to subscription, and all of them generate referrals. This means the bottom of the funnel is strong, but the middle needs optimization.
To improve this conversion path, focus on:
- aligning landing page messaging with ad intent
- improving webinar follow-ups and reminders
- strengthening CTAs during and after the event
In marketing funnels, small improvements in the middle stages often have the biggest impact on overall performance.
Your funnel isn’t working without the right pages. Start optimizing each step with conversion-focused builder.
What to Avoid in Conversion Funnel Analysis?
Conversion funnel analysis only works when the data is interpreted in context. The most common mistakes don’t come from missing tools – they come from reading the funnel too narrowly or reacting too quickly.
Overlooking micro-conversions
Focusing only on macro conversions limits your view of the funnel. Intermediate actions, such as CTA clicks, scroll depth, or form starts, reveal how users move through the conversion path and where friction begins.
Ignoring user segmentation
Looking at all users as one group hides important patterns. Analyze your funnel by traffic source, device, campaign type, or audience segment to understand where landing page performance changes.
Relying solely on averages
Average conversion rates can hide bottlenecks. Review each funnel stage separately to see where users drop off and which step causes the biggest loss.
Focusing only on successful conversions
A completed conversion shows what worked, but drop-offs often show more. Analyzing non-converting users helps uncover friction points that block progress.
Ignoring seasonal or external factors
User behavior changes with timing, promotions, market conditions, and campaign context. Funnel analysis should always account for these variables to avoid false conclusions.
Lack of regular analysis
Funnel analysis is not a one-time task. If you review performance too rarely, you miss shifts in user behavior and delay important optimizations.
Rushing to solutions without root cause analysis
A drop-off does not automatically explain the problem. Before making changes, identify what caused the issue – whether it’s weak messaging, poor UX, traffic mismatch, or form friction.
The goal is not to react to every number. The goal is to understand what the funnel is actually telling you and prioritize changes that improve conversion performance.
See how users interact, where they drop off, and get clear recommendations on what to optimize next.
FAQ About Conversion Funnel Analysis
Here are a few key questions that clarify how conversion funnel analysis works in practice:
What is funnel analysis?
Funnel analysis tracks how users move through each stage of the conversion funnel and identifies where they drop off. It helps you understand user behavior and optimize the conversion path based on real data.
What is a funnel strategy?
A funnel strategy is a structured approach to guiding users from first interaction to conversion. It defines how messaging, landing pages, and actions align at each stage to improve overall conversion performance.
What is a funnel report?
A funnel report is a visual representation of user behavior across each stage of the conversion funnel. It shows how many users move forward, where they drop off, and how the overall conversion path performs.
It typically includes key metrics such as conversion rates, drop-offs, and stage-by-stage performance, helping you identify bottlenecks and optimize your funnel for better results.
Why should you perform conversion funnel analysis?
Conversion funnel analysis helps you understand how users move through your funnel and where performance breaks down. It’s essential because it allows you to:
- identify drop-off points and friction in the conversion path
- improve landing page performance based on real behavior
- increase conversions by optimizing key funnel stages
- maximize ROI from existing traffic
- continuously adapt to changes in user behavior and campaigns
What is Conversion Rate Optimization?
Conversion Rate Optimization (CRO) is the process of improving a website or app to increase the percentage of visitors who complete desired actions, such as signing up for free trials or requesting demo versions.
CRO combines data analysis, A/B testing, and iterative improvements to refine the user experience and drive better conversion outcomes.
What are the best funnel analysis tools?
The best funnel analysis tools help you do more than collect data. They should show how users move through the conversion funnel, where they drop off, and which parts of the conversion path need attention.
Landingi supports this process with EventTracker, which tracks user behavior on landing pages, including clicks, scroll depth, and other micro-conversions. Solis, an AI agent for landing page optimization, builds on that data to analyze landing page performance in context and highlight the friction points most likely to affect conversions.
This combination makes funnel analysis more practical. Instead of stopping at raw metrics, teams can move faster from observation to optimization and improve landing page performance with clearer priorities.
Run Funnel Analysis to Improve Conversions on Landing Pages
Conversion funnel analysis is a core part of improving landing page performance. It helps you understand how users move through the conversion path, where they drop off, and which changes can improve results.
To run an effective funnel analysis, you need to:
- define funnel stages that match your goals
- choose the right tools
- track meaningful metrics
- analyze drop-off points and friction
- test improvements and repeat the process
The key is not just collecting data, but turning it into action. That’s where landing pages give teams an advantage – they can be tested and optimized faster than pages managed in a traditional CMS. Landingi supports this process as an AI landing page operation system. Teams can track user behavior with EventTracker, optimize performance with Solis – an AI landing page optimization tool – and improve pages continuously within one workflow. Try Landingi now!