EventTracker is a new tool by Landingi that tracks and monitors all events on your landing pages. Data is gathered automatically and is accessible right from your Dashboard.
With EventTracker, you can track micro-conversions like button clicks and scroll depths to get precise insights into user interactions and use the data to analyze, optimize, and enhance your landing pages.
How to track events with EventTracker?
Tracking landing page events with EventTracker is done automatically, eliminating the need for any configuration or code installation. Events data is visible on your landing page Dashboard immediately after they occur.
The current version of EventTracker is 0.7, which allows you to track button clicks, click events, lightbox events, pay button events, form events, and scroll events. You can integrate EventTracker with Google Analytics 4 to automatically send events GA4’s Reports tab. You can also filter by country, device, and UTM parameters.
Navigate to the end of this guide for a list of upcoming EventTracker capabilities.
How to access the events data?
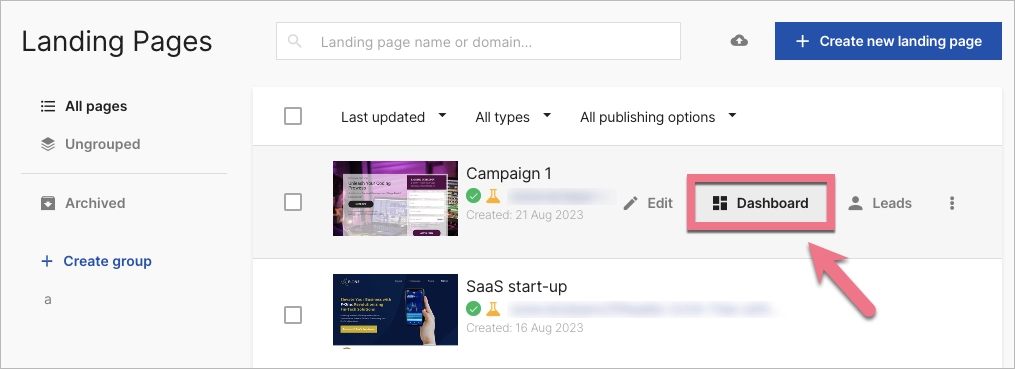
1. Go to your landing page Dashboard.

2. Go to the Events tab.

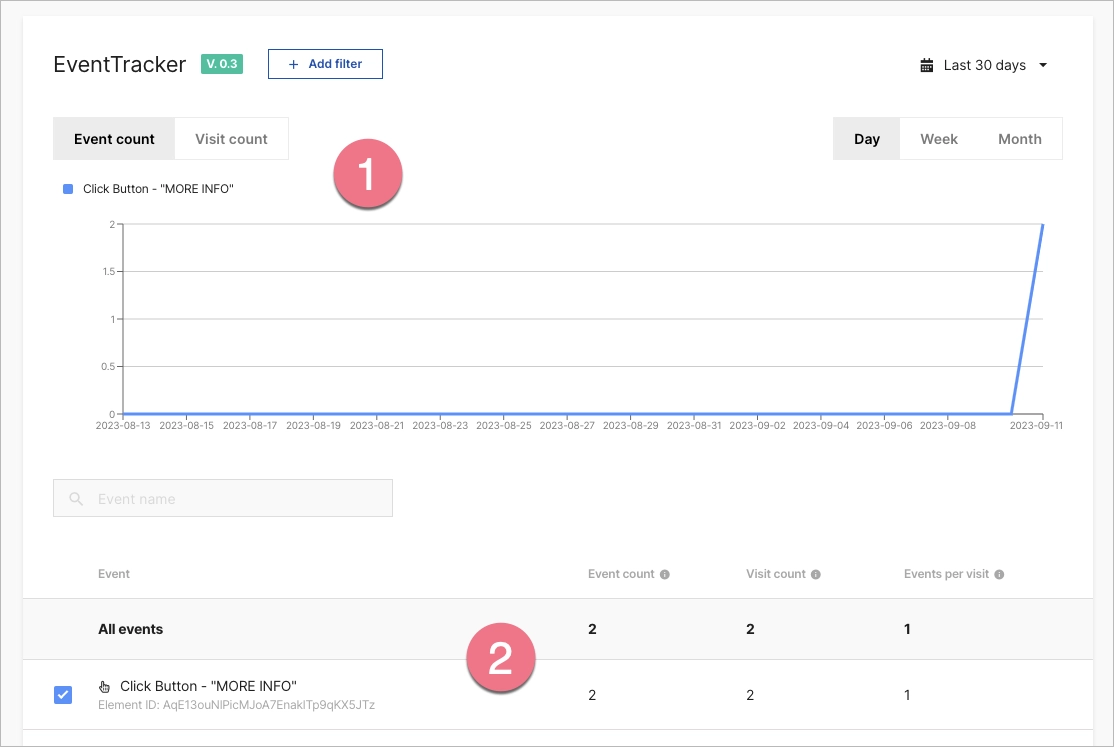
3. You will see event data in the form of a graph and a list. The data is collected from the moment you start EventTracker on your account.
Remember that the information about the event will appear in your Dashboard only if a user performs a specific interaction on your page.
- In this tab’s first section, there is a chart displaying the number of events or visits.
- In the second section, you can view a list of all events.

What is the plan for the development of EventTracker?
The development of EventTracker projects more capabilities every few weeks. Soon you will be able to:
- track video events
- sort events, filter by type of events, rename events, search events
- use events and scroll map
- overview data, change the conversion goal of a landing page
- create event combinations (custom events)
Learn more in the EventTracker’s roadmap.