A heatmap tool helps you see how visitors actually interact with a webpage. It provides a visual picture of user behavior, showing where people click, how far they scroll, and which elements capture the most attention.
Heatmap software has become a staple of website and landing page optimization because it turns complex behavioral data into patterns that are easy to understand. In 2026, many marketing teams combine heatmaps with event tracking, A/B testing, and AI-powered optimization to gain a more complete view of the customer journey. In Landingi, EventTracker provides Event Maps and Scroll Maps for landing pages, while Solis analyzes behavioral data and recommends improvements designed to increase conversions.
In this guide, we’ll compare the best heatmap tools for user behavior analytics and landing page optimization. You’ll see how they work, where they differ, and which solutions provide the most useful insights for improving conversion rates.

8 Best Heatmap Tools for Landing Page Optimization
Not all heatmap tools provide the same level of insight. Some focus primarily on click and scroll visualization, while others combine heatmaps with session recordings, event tracking, analytics, A/B testing, or AI-powered optimization. The right choice depends on what you’re trying to improve – a website, an ecommerce store, or a conversion-focused landing page.
Below, you’ll find eight of the best heatmap tools available, along with their strengths, limitations, and ideal use cases for landing page optimization and user behavior analysis.
#1 EventTracker + Solis – best heatmap tool for landing pages
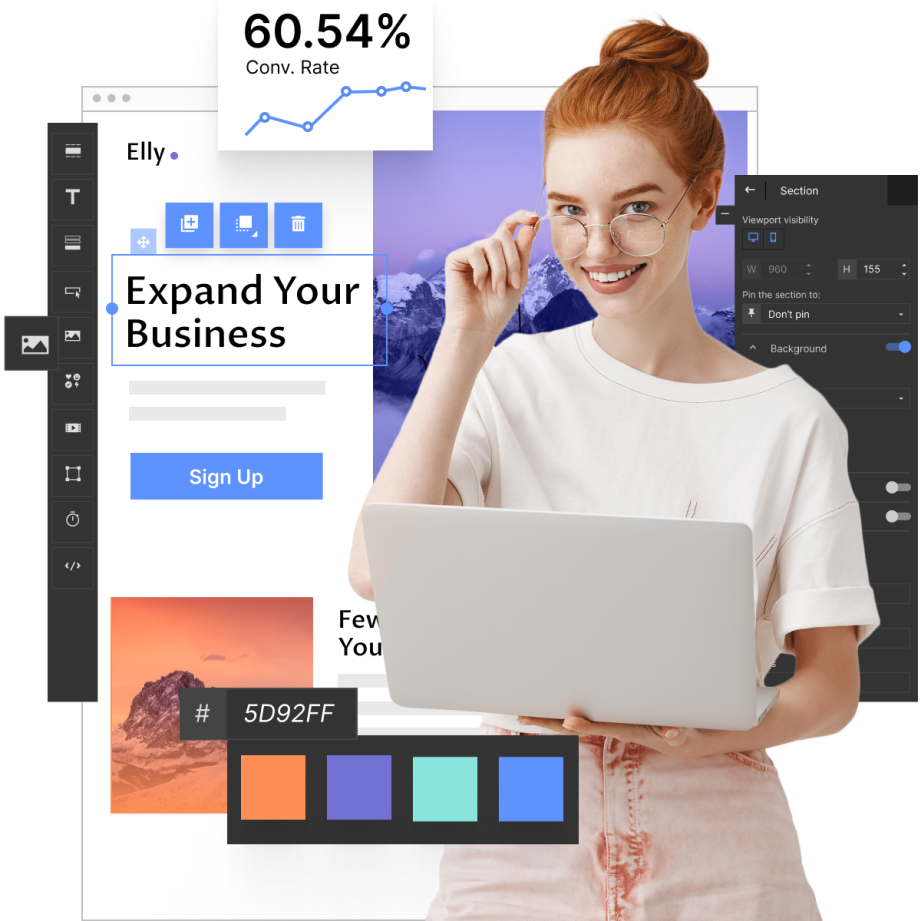
EventTracker is a user behavior analytics tool built directly into Landingi’s landing page operation system. It combines event tracking with visual Event Maps and Scroll Maps, helping marketers understand how visitors interact with landing pages and which elements influence conversions.
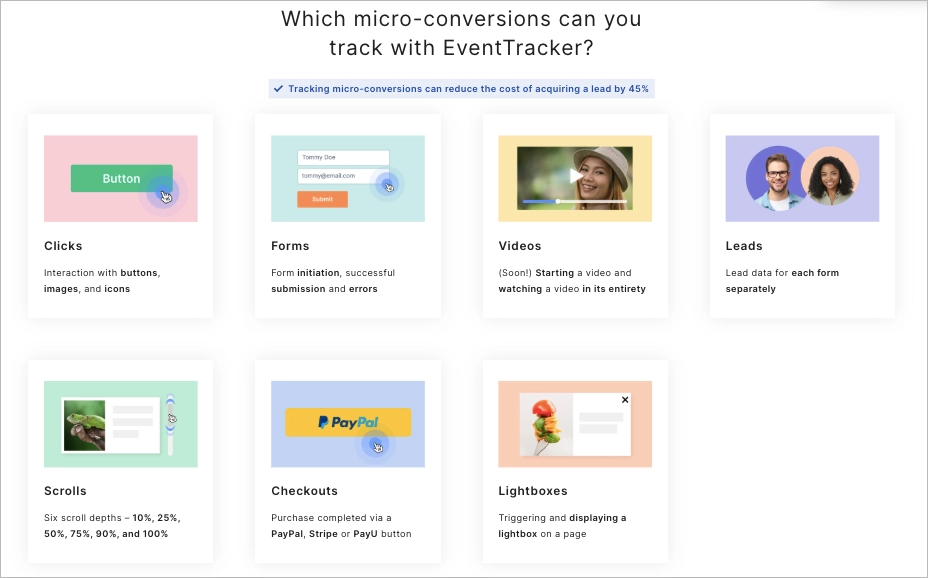
Unlike traditional heatmap software that focuses primarily on clicks and scroll depth, EventTracker captures a broader set of interactions automatically. Marketers can track button clicks, form starts, form submissions, scroll behavior, lightbox interactions, checkout actions, and other micro-conversions without configuring individual events or adding custom code.
One of EventTracker’s biggest advantages is simplicity. After publishing a landing page, data starts collecting automatically. There’s no need to configure tags, create event structures, or manually define every interaction. All tracked events appear directly in the dashboard, making it easy to analyze visitor behavior and identify friction points.
The platform also includes Event Maps and Scroll Maps, allowing teams to visualize which page elements attract attention and how far visitors move through the page. Combined with A/B testing, these insights help marketers build stronger optimization hypotheses and improve conversion performance based on real user behavior.

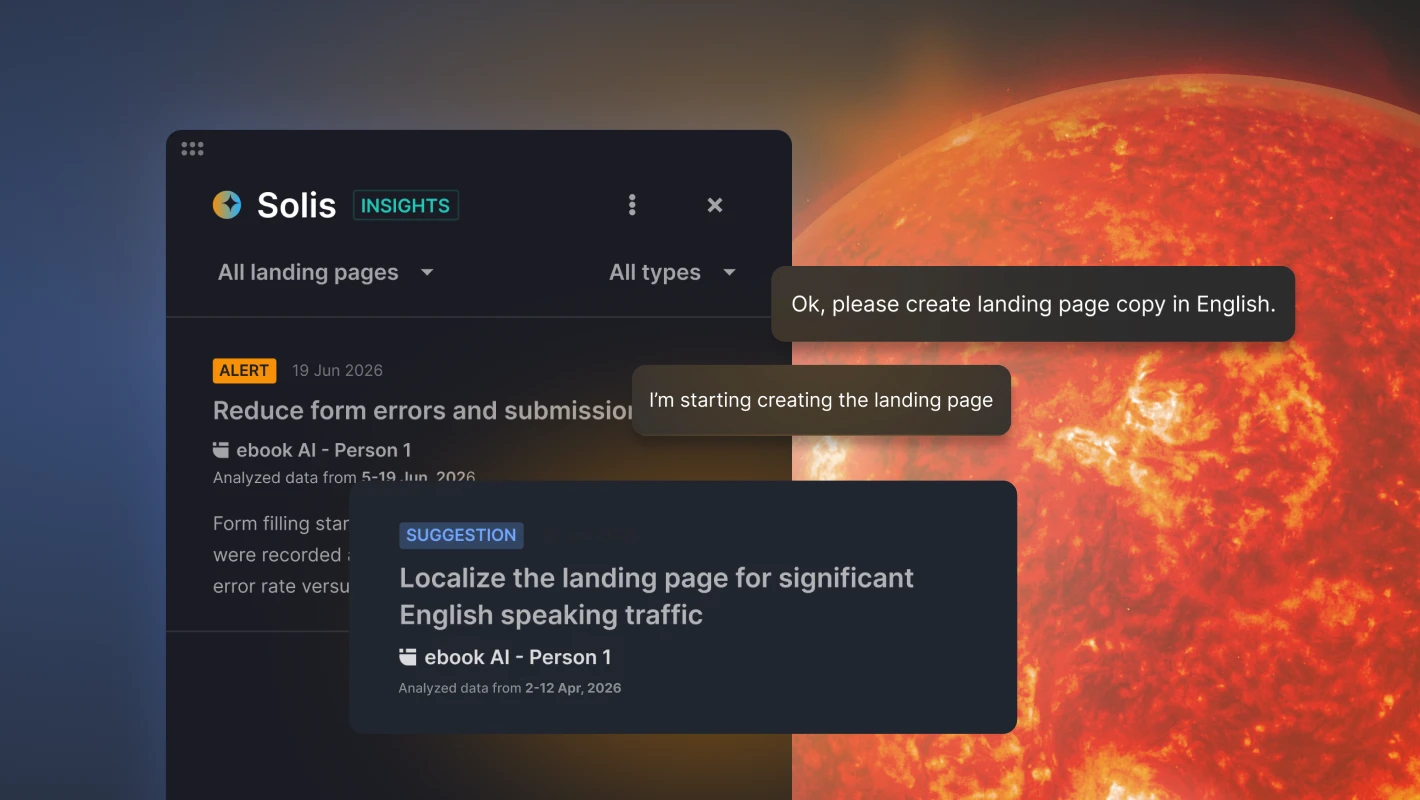
What makes the workflow particularly powerful is its integration with Solis. Solis analyzes EventTracker data in the context of the landing page, identifies conversion bottlenecks, and recommends specific improvements designed to increase results. Rather than spending hours reviewing reports manually, teams receive actionable insights supported by behavioral data.
Best for: marketers, PPC teams, agencies, and businesses focused on landing page optimization and conversion rate optimization.
Key features:
- Event Maps and Scroll Maps
- Automatic event tracking without code
- Micro- and macro-conversion tracking
- Form interaction analytics
- Landing page A/B testing
- AI-powered optimization recommendations through Solis
- Built-in landing page publishing and optimization workflow
See how visitors click, scroll, engage, and convert – then use AI-powered insights to improve landing page performance.
#2 Microsoft Clarity – best free heatmap tool
Microsoft Clarity is a free website heatmap tool that combines click and scroll heatmaps with session recordings and behavioral analytics. Backed by Microsoft, it has become one of the most widely used solutions for understanding how visitors interact with websites and landing pages.

The platform helps marketers identify engagement patterns, friction points, and user navigation paths through visual heatmaps and real user session recordings. Its intuitive interface makes behavioral analysis accessible even for teams with limited analytics experience. While it lacks some of the advanced optimization and experimentation capabilities found in specialized conversion rate optimization tools, it offers impressive functionality for a free solution.
Key features:
- Click and scroll heatmaps
- Session recordings
- User behavior analytics
- Insights dashboard
- Integration with Google Analytics and Microsoft products
Best for: businesses looking for a free heatmap software solution to analyze website and landing page performance.
#3 VWO – best heatmap tool for data analytics
VWO combines heatmaps with a broader conversion optimization toolkit, making it a popular choice for teams that rely heavily on data when improving websites and landing pages. Beyond visualizing clicks and scroll behavior, it helps marketers connect user interactions with testing and optimization efforts.
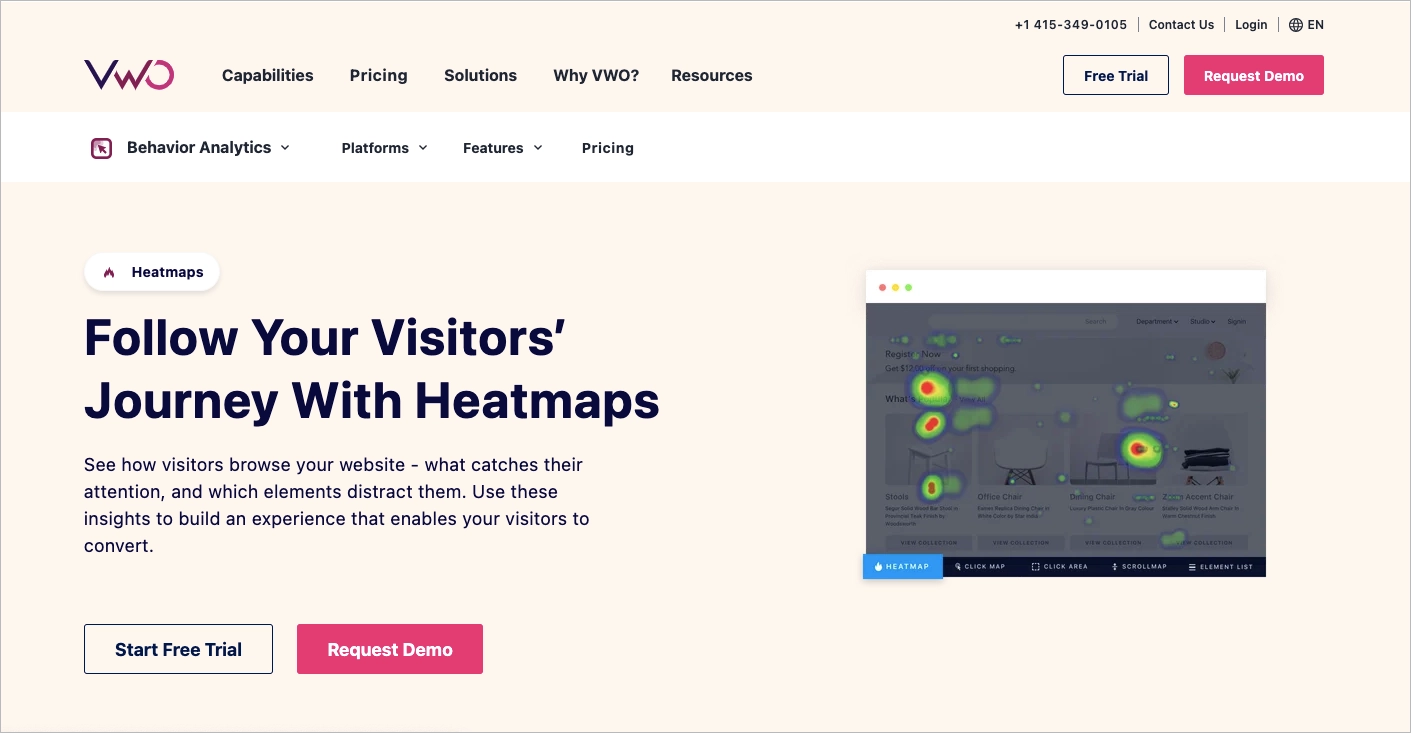
The platform includes heatmaps, session recordings, surveys, visitor segmentation, and experimentation features, allowing teams to analyze behavior from multiple angles. While VWO offers powerful insights for conversion rate optimization, its extensive feature set can feel overwhelming for smaller teams or users looking for a lightweight heatmap solution.
Key features:
- Click and scroll heatmaps
- Session recordings
- Visitor segmentation
- On-page surveys
- A/B testing and experimentation tools
- Collaboration and reporting features
Best for: marketing and CRO teams looking for advanced user behavior analytics and data-driven optimization.
#4 Crazy Egg – best heatmap tool for UX optimization
Crazy Egg is a long-established heatmap software platform focused on helping marketers and UX teams understand how visitors interact with websites. It combines visual behavior analysis with testing and reporting tools that support ongoing user experience improvements.

The platform offers multiple heatmap views, session recordings, traffic segmentation, and built-in A/B testing capabilities. Its visual reports make it easy to identify engagement hotspots and usability issues. While Crazy Egg remains a strong choice for UX-focused teams, some users report limitations when analyzing complex mobile interactions compared to more specialized user behavior analytics platforms.
Key features:
- Click and scroll heatmaps
- Session recordings
- Traffic source segmentation
- A/B testing
- Multiple heatmap reports, including Confetti and Overlay
- Long-term data retention
Best for: marketers and UX teams focused on improving user experience and on-page engagement.
#5 Hotjar – best heatmap tool for understanding user behavior
Hotjar is one of the most recognizable heatmap tools on the market, combining heatmaps with session recordings, surveys, feedback widgets, and user interviews. Its strength lies in helping marketers understand not just what users do, but often why they do it.

The platform visualizes clicks, cursor movements, and scroll behavior while complementing quantitative data with direct user feedback. This makes Hotjar particularly useful for identifying usability issues, testing assumptions, and improving customer journeys. However, teams focused primarily on conversion rate optimization may find themselves relying on additional tools for experimentation and deeper analytics.
Key features:
- Click, move, and scroll heatmaps
- Session recordings
- Surveys and feedback widgets
- User interviews
- Behavior analytics dashboard
- Long-term data retention
Best for: teams looking to combine user behavior analytics with customer feedback and qualitative research.
#6 Lucky Orange – best heatmap tool for ecommerce
Lucky Orange is a website heatmap tool designed to help ecommerce businesses understand customer behavior and improve conversions. It combines dynamic heatmaps with session recordings, funnel analysis, and form analytics, making it easier to identify where shoppers engage, hesitate, or abandon the buying process.

The platform stands out for its real-time analytics and detailed interaction tracking across forms, pop-ups, menus, and product pages. Its feature set is particularly valuable for online stores, although teams with more advanced analytics needs may find its data retention and reporting capabilities somewhat limited.
Key features:
- Dynamic heatmaps
- Session recordings
- Funnel analysis
- Form analytics
- Real-time visitor tracking
- User segmentation and filtering
Best for: ecommerce businesses looking to optimize customer journeys and increase online sales.
#7 Mouseflow – best heatmap tool for real-time tracking
Mouseflow is a user behavior analytics platform known for its real-time tracking capabilities and extensive heatmap collection. It helps marketers, UX teams, and CRO specialists monitor visitor interactions as they happen while uncovering friction points that affect conversions.

The platform offers six heatmap types, including Click, Scroll, Attention, Movement, Geo, and Live heatmaps, alongside session recordings and behavioral analytics. Its depth of insight makes it particularly valuable for advanced optimization projects, although new users may face a steeper learning curve compared to more streamlined heatmap tools.
Key features:
- Six heatmap types, including Live Heatmaps
- Session recordings
- Real-time visitor tracking
- Friction score analysis
- User journey analytics
- Integrations with analytics and marketing tools
Best for: teams that need real-time user behavior tracking and advanced website optimization insights.
#8 Attention Insight – best AI heatmap tool
Attention Insight takes a different approach from traditional heatmap software. Instead of analyzing real visitor interactions, it uses AI-powered predictive eye-tracking to estimate which elements are most likely to attract attention before a page, ad, or design goes live.

The platform generates AI heatmaps, focus maps, attention scores, and clarity metrics in seconds, making it particularly useful during the design and validation phase. While its predictions are based on extensive behavioral research, they remain forecasts rather than actual user behavior, so many teams use Attention Insight alongside heatmap and user behavior analytics tools that collect real-world data.
Key features:
- AI-powered predictive heatmaps
- Attention and focus maps
- Clarity score analysis
- Design validation before launch
- Fast visual testing
- Integrations with popular design tools
Best for: designers and marketers who want to evaluate visual attention and optimize layouts before launching campaigns or landing pages.
Heatmap Tools vs. Event Tracking: What’s the Difference?
Heatmaps show where users interact with a page, while event tracking shows what actions they take and how those actions contribute to conversions.
A landing page heatmap can reveal that users frequently click a button or stop scrolling before reaching a key section. Event tracking goes a step further by measuring specific interactions, such as form starts, form submissions, CTA clicks, checkout completions, or other micro-conversions. Together, they provide a much clearer picture of the customer journey.
Many marketers use separate heatmap software and analytics tools to gather these insights. In Landingi, both are available through EventTracker, which combines Event Maps, Scroll Maps, and event tracking in a single landing page optimization workflow. The collected data can then be analyzed by Solis, Landingi’s AI landing page optimization tool, which identifies conversion bottlenecks and recommends improvements.
| Heatmap Tools | Event Tracking |
| Show where users click and scroll | Measure specific user actions and conversions |
| Visualize engagement patterns | Quantify interactions and outcomes |
| Help identify attention hotspots | Help identify conversion bottlenecks |
| Focus on page behavior | Focus on user actions |
| Useful for UX and layout optimization | Useful for CRO and performance analysis |
| Answer: “Where are users interacting?” | Answer: “What are users doing?” |
The most effective landing page optimization strategies use both approaches together.
Turn user behavior insights into actionable improvements with EventTracker and Solis.
FAQ For Heatmap Software
Heatmap tools, event tracking platforms, and user behavior analytics solutions can generate a lot of data. Below, you’ll find answers to some of the most common questions about heatmap software, landing page optimization, and using behavioral insights to improve conversion rates.
What is a heatmap?
A heatmap is a visual representation of user behavior on a webpage. It uses color coding to show where visitors click, how far they scroll, or which sections attract the most attention. Areas with higher engagement typically appear in warmer colors, while less active areas appear in cooler tones.
Heatmaps help marketers move beyond assumptions and understand how people actually interact with a page. By revealing engagement patterns, they make it easier to improve layouts, reposition important elements, and optimize user journeys. That’s why heatmaps have become one of the most widely used tools for landing page optimization and conversion rate optimization..
Combine heatmaps, event tracking, and AI-powered recommendations to optimize landing pages with greater confidence.
What is conversion rate optimization?
Conversion rate optimization (CRO) is the process of increasing the percentage of visitors who complete a desired action on a webpage, such as submitting a form, requesting a quote, signing up for a newsletter, or making a purchase.
CRO combines user behavior analytics, testing, and data-driven improvements to remove friction and make conversions more likely. Heatmap tools, event tracking, and A/B testing play a central role in this process by revealing how visitors interact with a page and which changes have the greatest impact on results. The goal isn’t simply to attract more traffic – it’s to get more value from the traffic you already have.
What is a conversion optimization tool?
A conversion optimization tool is a type of software designed to help businesses analyze, test, and improve the performance of websites and landing pages. These tools provide data about visitor behavior and page performance, making it easier to identify obstacles that prevent users from completing desired actions.
Conversion optimization tools include heatmap software, event tracking platforms, A/B testing solutions, session recording tools, web analytics platforms, and user feedback systems. By combining these insights, marketers can make data-driven improvements that increase conversion rates and improve the overall user experience.
Stop guessing. A/B test headlines, CTAs, and more in Landingi!
How heatmap tools improve landing page performance?
Heatmap tools improve landing page performance by showing how visitors actually interact with a page. They reveal where users click, how far they scroll, and which elements attract the most attention, helping marketers identify friction points and optimization opportunities.
For example, a landing page heatmap can show whether visitors notice a CTA, engage with key sections, or abandon the page before reaching important content. These insights make it easier to refine layouts, improve user experience, and prioritize high-impact changes. Combined with A/B testing and event tracking, heatmaps become a powerful tool for continuous landing page optimization.
What is a heatmap software?
Heatmap software is a type of user behavior analytics tool that visualizes how visitors interact with a webpage. Using color-coded overlays, it highlights where users click, how far they scroll, and which elements receive the most attention.
By turning behavioral data into easy-to-read visual patterns, heatmap tools help marketers identify friction points, improve page layouts, and make more informed landing page optimization decisions.
What type of data is best visualized with a heatmap?
Heatmaps are most effective for visualizing user engagement and interaction data, including:
- Click activity
- Scroll depth
- Attention hotspots
- Mouse movement patterns
- Engagement with specific page elements
These visual insights help teams understand how visitors navigate a page, which content captures attention, and where optimization opportunities may exist.
What are the benefits of using heatmaps?
Heatmaps help marketers and CRO teams understand how visitors interact with a webpage without digging through complex analytics reports. By visualizing user behavior, they make it easier to spot engagement patterns, usability issues, and conversion opportunities.
Key benefits include:
- Identifying user behavior patterns
- Discovering overlooked or underperforming content
- Finding friction points and drop-off areas
- Improving page layouts and content placement
- Supporting data-driven landing page optimization
When combined with event tracking and A/B testing, heatmaps provide valuable insights that can lead to better user experiences and higher conversion rates.
Analyze clicks, scroll behavior, and engagement patterns to uncover new optimization opportunities.
What are the different types of heatmaps?
Several types of heatmaps help visualize different aspects of user behavior:
- Click heatmaps show where visitors click or tap on a page.
- Scroll heatmaps reveal how far users scroll and where they stop engaging.
- Move heatmaps track cursor movement patterns, which can indicate areas of visual attention.
- Attention heatmaps highlight sections that receive the highest levels of engagement.
- AI heatmaps predict where users are likely to focus before a page is published.
Each type provides a different perspective on user behavior, helping marketers improve content placement, navigation, page structure, and overall landing page performance.
Can excel make a heatmap?
Yes. Excel can create basic heatmaps using conditional formatting, which applies color gradients to cells based on their values. This makes it useful for visualizing trends, outliers, and patterns in spreadsheet data.
However, Excel heatmaps are designed for static datasets. They cannot track clicks, scroll behavior, user engagement, or other interactions on websites and landing pages. For user behavior analytics and landing page optimization, dedicated heatmap software provides far more actionable insights.
What should you look for when choosing heatmap software?
The best heatmap software should provide accurate behavioral data while fitting naturally into your optimization workflow. Beyond heatmaps themselves, it’s worth considering whether the platform offers complementary features that help turn insights into improvements.
Look for:
- Accurate and reliable data collection
- Multiple heatmap types (click, scroll, attention, etc.)
- Session recordings or event tracking
- A/B testing capabilities
- Integrations with your existing marketing stack
- Easy-to-understand reporting
- Transparent pricing and strong customer support
The most valuable platforms don’t just show user behavior – they help you understand why it happens and what to do next.
How to use heatmaps to optimize a landing page?
Start by identifying where visitors engage and where they lose interest. A landing page heatmap can reveal whether users notice key CTAs, interact with important content, or abandon the page before reaching high-value sections.
Look for patterns such as:
- Frequently clicked elements
- Ignored CTAs
- Sharp drop-offs in scroll depth
- Distracting page elements
- Sections that receive unusually high attention
Use these insights to create optimization hypotheses. For example, if users rarely reach a form, move it higher on the page. If a CTA receives little attention, test a different placement, design, or message. The most effective approach combines heatmaps with event tracking and A/B testing, allowing you to validate changes with real performance data rather than assumptions.
Combine heatmaps, event tracking, and A/B testing to uncover opportunities and continuously improve landing page performance.
Optimize Landing Pages with Landingi and EventTracker
Choosing the right heatmap software is important, but collecting data is only part of the optimization process. The real challenge is turning user behavior insights into meaningful improvements that increase conversions.
Landingi brings landing page creation, EventTracker, A/B testing, and AI-powered optimization together in a single landing page operation system. With EventTracker’s Event Maps and Scroll Maps, marketers can see how visitors interact with landing pages, while event tracking captures conversions and micro-conversions such as button clicks, form interactions, and checkout events.
The workflow goes a step further with Solis, Landingi’s AI landing page optimization tool. Solis analyzes EventTracker data in the context of your landing page, identifies friction points, and recommends changes that can improve performance. This allows teams to move from observation to optimization much faster, without switching between multiple platforms.
Whether you’re optimizing lead generation campaigns, PPC landing pages, or product-focused funnels, combining heatmaps, event tracking, A/B testing, and AI insights creates a more complete picture of what drives conversions. Try Landingi now!