Google Ads Quality Score is a 1–10 diagnostic rating assigned at the keyword level in Search campaigns. The Quality Score rating estimates how relevant and useful an ad is for users based on three components: expected click-through rate (CTR), ad relevance, and landing page experience. In digital advertising, Quality Score influences Ad Rank and cost per click (CPC), and it helps advertisers evaluate competitiveness within the ad auction.
A higher Quality Score can reduce CPC and improve ad placement. According to WordStream, keywords with a Quality Score of 10 can achieve up to 50% lower CPC compared with average-performing ads.
This article explains what Quality Score represents, how Quality Score differs from Ad Rank, and how to improve Quality Score using practical optimization steps.
Key Facts
- Quality Score is rated on a 1–10 scale at the keyword level.
- Quality Score is a diagnostic tool, not a performance metric.
- Quality Score is based on expected CTR, ad relevance, and landing page experience.
- The visible 1–10 Quality Score rating does not directly enter the auction.
- Higher ad quality can improve your Ad Rank and reduce CPC.

What is Google Ads Quality Score?
Google Ads Quality Score is a diagnostic tool that shows how ad quality compares with other advertisers targeting similar keywords. Inside your Google Ads account, Quality Score is visible at the keyword level and serves as a quick diagnostic indicator of ad quality.
Quality Score is measured on a 1–10 scale and available at the keyword level in Search campaigns. Google calculates it based on expected click-through rate, ad relevance, and landing page experience, evaluating how well your ads respond to a user’s search query.
In practice, Quality Score helps you locate problems in ads, keywords, and landing pages. It highlights weak areas in ad quality before they hurt performance.
Think of Quality Score as a keyword-level health check for your campaigns. It helps you understand how well your ads align with a user’s search and how competitive they are within the auction environment.
Higher Quality Scores (7–10) reduce costs per click (CPC) and improve ad positions. Lower Quality Scores (1–3) increase costs per click (CPC) and limit visibility.
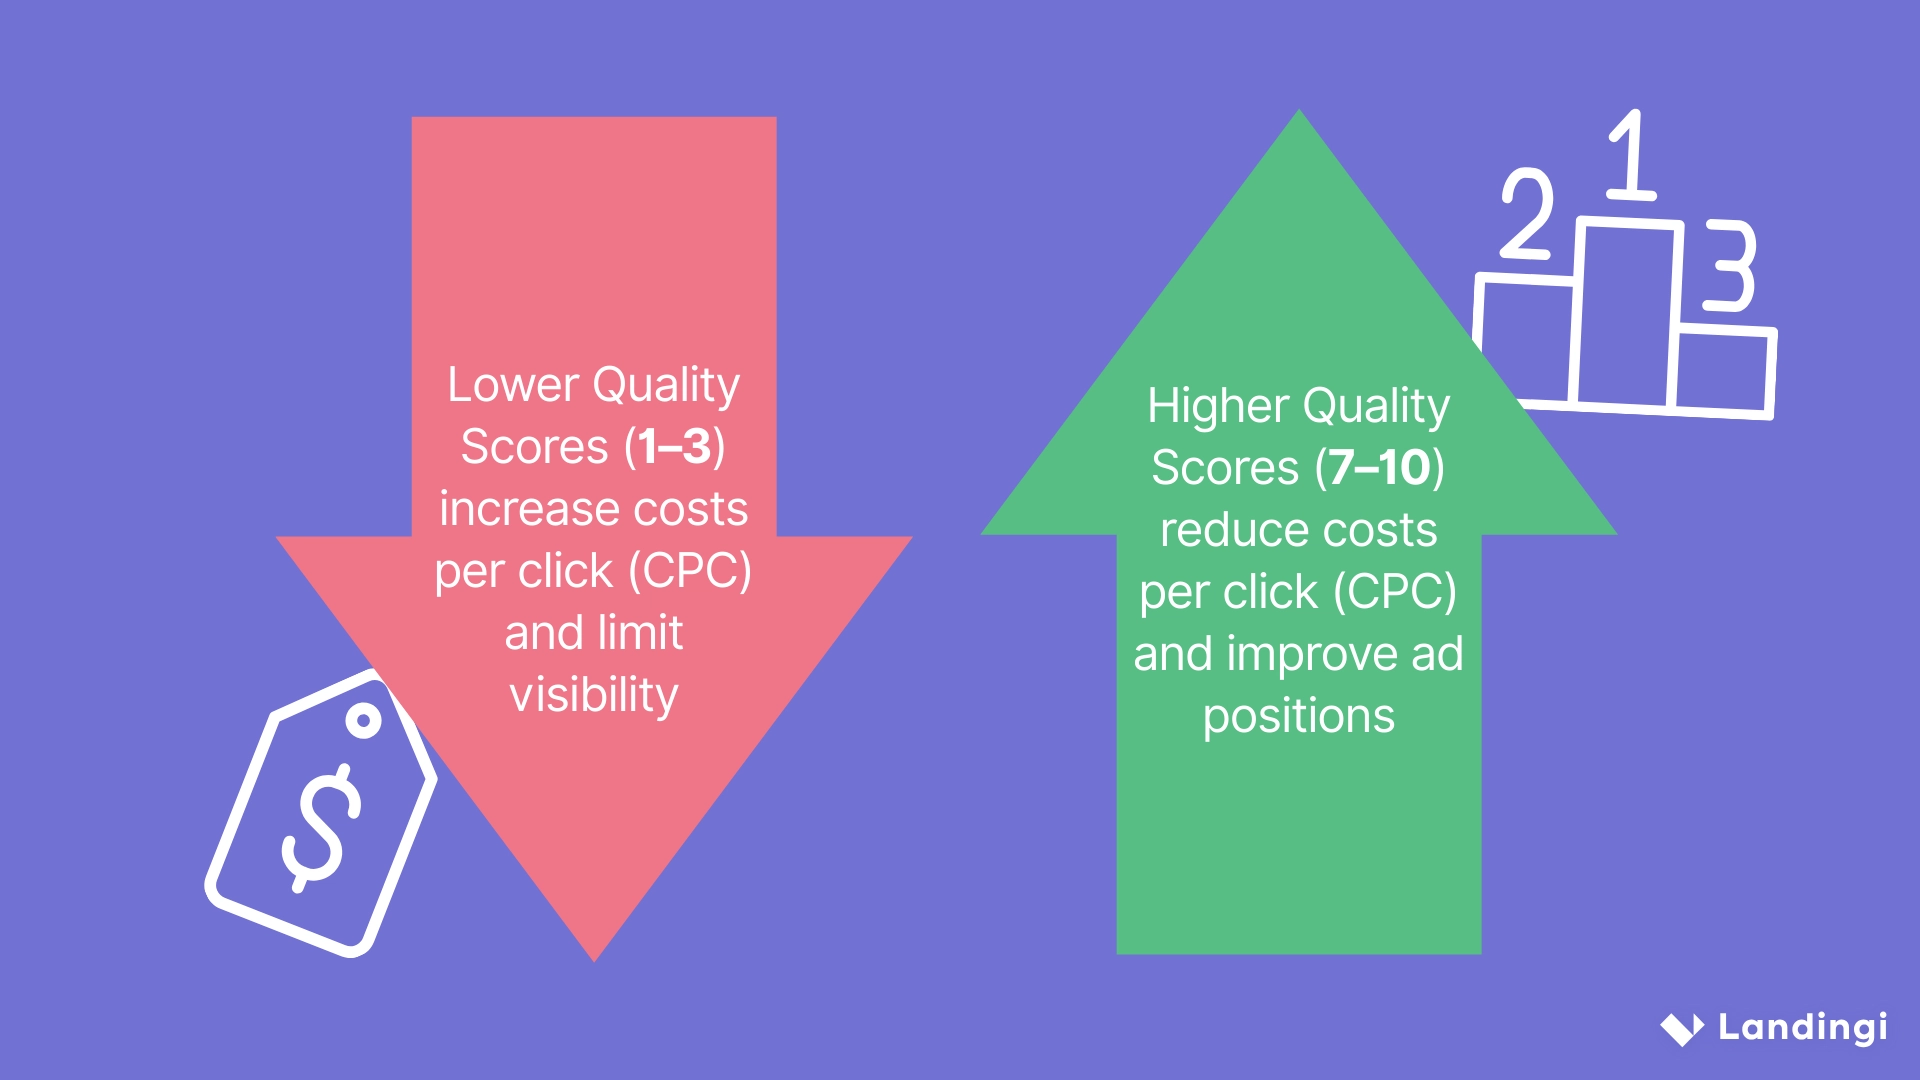
Google states that higher quality ads can lead to better ad positions and lower costs, even with similar bids.
How to interpret Quality Score signals
When analyzing campaign performance, use Quality Score components as diagnostic guidance:
- If CPC is high and impressions are low, review Ad Rank and keyword eligibility before adjusting Quality Score factors.
- If impressions are stable but CTR is weak, prioritize improvements in expected CTR and ad copy relevance.
- If CTR is strong but conversions are low, evaluate landing page experience and intent alignment.
Quality Score is most reliable in Search campaigns with stable traffic and clear keyword intent segmentation. For new or low-volume keywords, Quality Score ratings may fluctuate due to limited data. In early-stage campaigns, prioritize campaign structure, keyword grouping, and message consistency before focusing on score optimization.
Turn better ads into better results. Build landing pages that lift your Quality Score!
Is Quality Score a KPI?
Quality Score is not a KPI. Google defines Quality Score as a diagnostic tool and advises advertisers not to aggregate the 1–10 rating with core performance metrics.
It does not represent real-time auction performance. It also does not measure profitability.
Instead of focusing on Quality Score as a goal, track business metrics. Monitor CPA to control acquisition cost. Track ROAS to measure return on ad spend. Watch conversion rate to see how traffic performs. Check impression share to understand visibility.
Quality Score supports performance analysis, but it should not replace business KPIs. Well-structured ad campaigns that deliver strong engagement and conversions often generate higher Quality Scores as a byproduct of performance improvements.
Quality Score vs Ad Rank
Quality Score is a visible 1–10 diagnostic score, while Ad Rank determines your actual ad position in the auction.
Ad Rank decides whether your ad shows and where it appears. It is calculated using bid amount, auction-time ad quality signals, and other factors. Ads with low Quality Scores (typically 1–3) may not be eligible to show, regardless of bid amount.
Although the 1–10 score is not directly used in auctions, the same core quality signals influence both Quality Score and Ad Rank. While advertisers may see the same Quality Score, their Ad Rank can still differ depending on bids and auction-time signals. Expected CTR, ad relevance, and landing page experience shape ad quality. Improving these factors can raise Ad Rank, improve ad placements, and lower CPC.
If a keyword maintains a low Quality Score but continues to win auctions due to high bids, reducing CPC is often possible by improving the weakest quality component instead of increasing spend.
What are the Components of Quality Score?
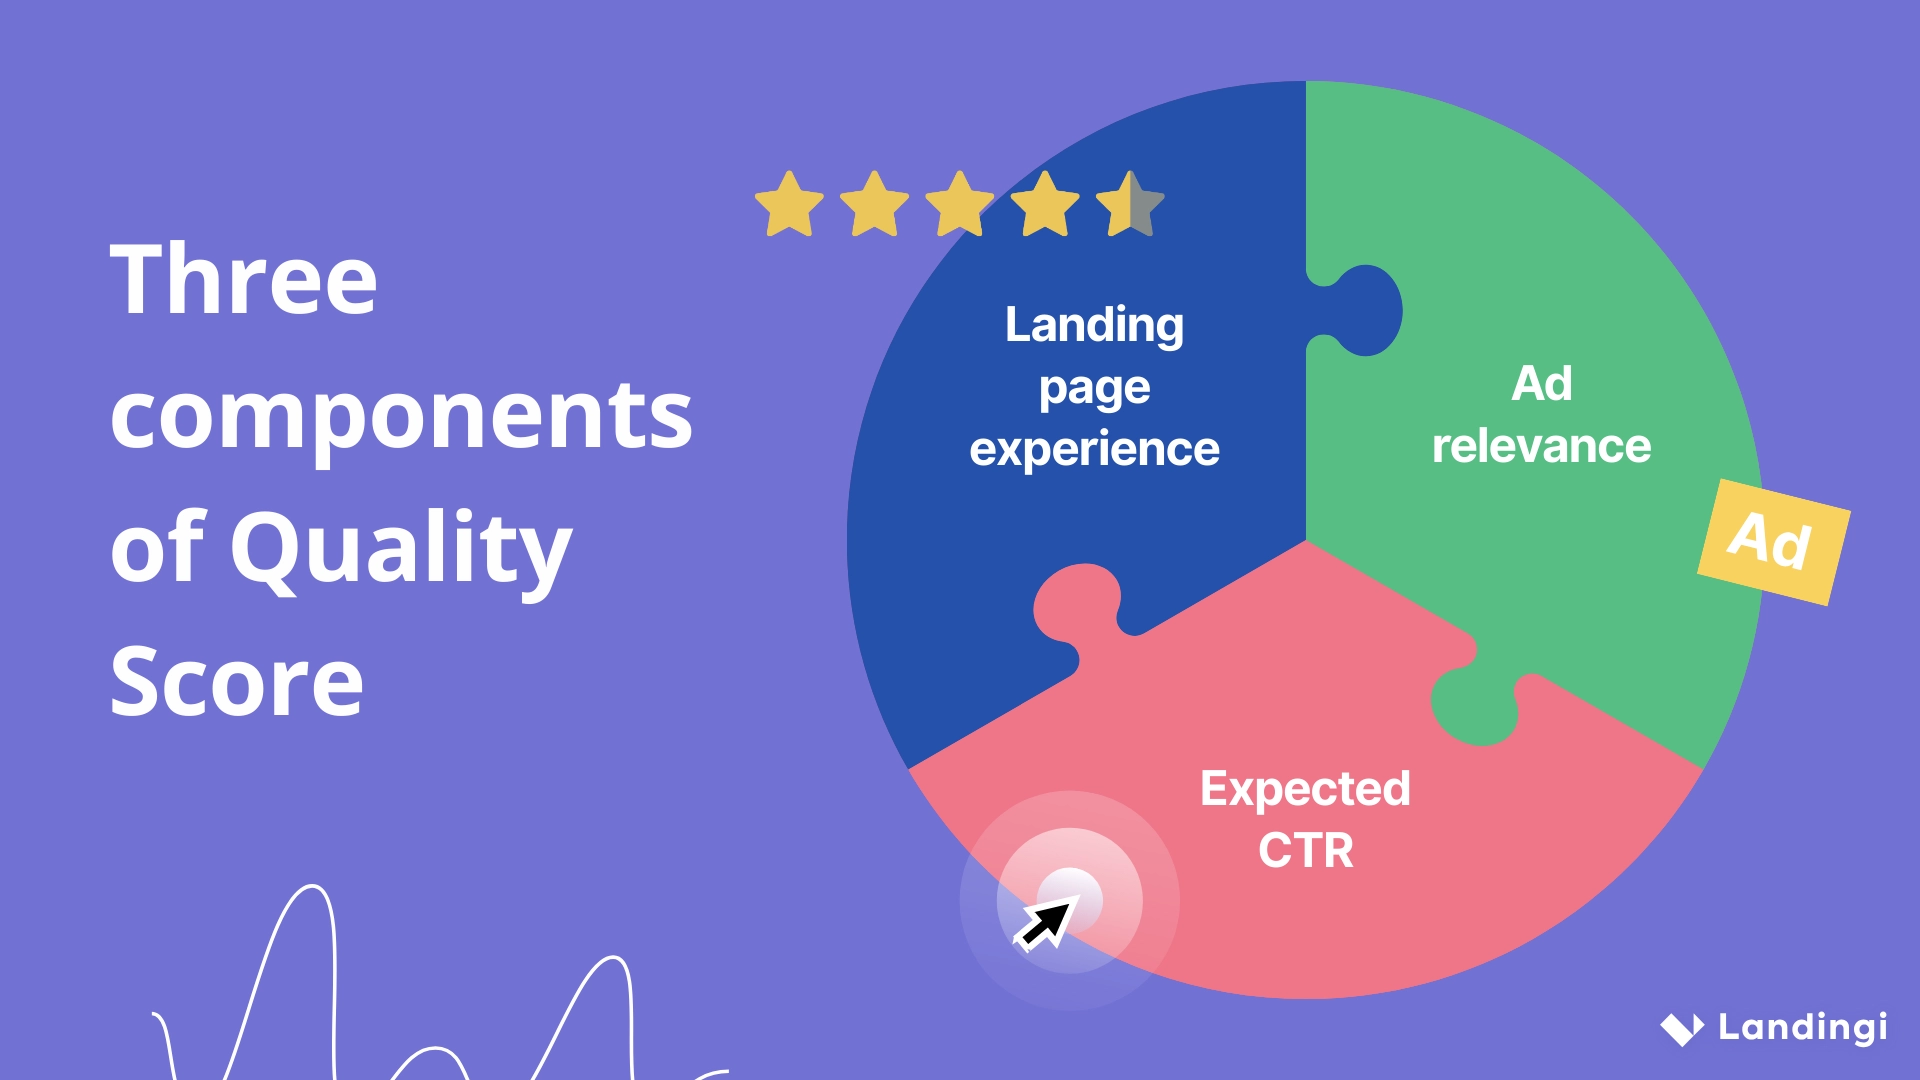
Components of Quality Score are expected click-through rate (CTR), ad relevance, and landing page experience. These elements are known as Quality Score factors, and they determine how competitive your ads are within Google’s ecosystem. These three elements estimate how useful and relevant your ad is to users.
Expected CTR predicts how likely users are to click your ad when it appears for specific search terms. It is based on past performance and auction signals. If expected CTR is below average, test new headlines and offers and tighten keyword intent within the ad group.
Ad relevance measures how closely your ad matches the intent behind a keyword. If your keyword is “running shoes,” your ad should clearly mention running shoes. If ad relevance is below average, split mixed-intent ad groups and rewrite copy to mirror the exact keyword theme.
Landing page experience evaluates how useful and relevant your page is after the click. This includes landing page quality, content relevance, transparency, and usability. Google looks at content relevance, transparency, and ease of navigation. If landing page experience is below average, align page content to the query intent and remove friction (speed, clarity, form complexity).
Each component of Quality Score is rated as “Above average,” “Average,” or “Below average.” Improving even one weak component can lift your overall Quality Score.
Upgrade your landing page experience with Landingi. From first click to micro-conversion – optimize every step.
How to Check Quality Score in Google Ads?
To check Quality Score in Google Ads, go to your Search campaign, open the Keywords tab, customize columns, and add Quality Score and its components.
Quality Score is available at the keyword level for Search campaigns. Ad Group Quality Score is determined by the average Quality Scores of the keywords within that ad group.
Here is the full process of checking Quality Score in simple steps:
- Open your Google Ads account.
- Select the Search campaign you want to review.
- Click on “Keywords” in the left menu.
- Click the “Columns” icon.
- Choose “Modify columns.”
- Add “Quality Score,” “Expected CTR,” “Ad relevance,” and “Landing page experience” in the Quality Score column view.
- Save your changes.
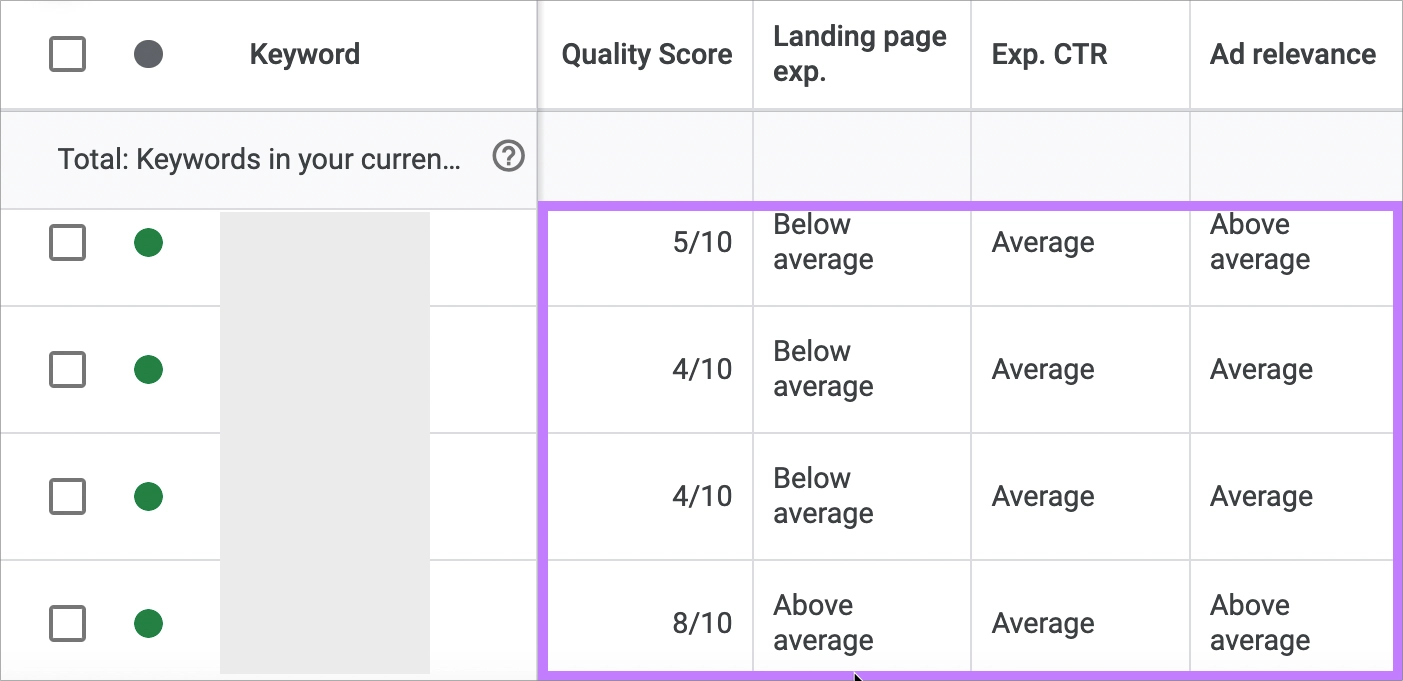
The keyword table will now display the 1–10 Quality Score and the diagnostic status for each component.
For optimization prioritization:
- Sort keywords by lowest Quality Score first.
- Focus on keywords with high spend and low Quality Score.
- Prioritize keywords marked “Below average” in any component.
High-spend, low-score keywords typically offer the fastest performance gains.
Your ads deserve a high-converting home. Create it with Landingi today.
What Does “Above Average / Average / Below Average” Mean?
In Google Ads, the labels “Above Average,” “Average,” and “Below Average” compare your ad quality components against other advertisers targeting the same keyword. These labels apply to expected CTR, ad relevance, and landing page experience.
“Above average” means your performance is stronger than competitors for that keyword.
“Average” means your performance is similar to others competing for the same keyword in the search results.
“Below average” signals a weakness that likely lowers your Quality Score.
These ratings are relative, not absolute. A keyword may show strong historical CTR but still receive a “Below average” rating if competing ads perform better.
Treat “Below average” as a clear optimization signal. If expected CTR is below average, improve headlines and offers. If ad relevance is below average, restructure ad groups and tighten keyword grouping. If landing page experience is below average, align your page content with the keyword and ad.
Start with high-spend keywords that show “Below average” in at least one component. Once performance improves, apply structural changes to similar keyword groups to scale results.
These diagnostic labels help identify issues before they negatively impact CPA or ROAS.
6 Common Causes of Low Quality Score
Low Quality Score in Google Ads are caused by low ad relevance, poor landing page experience, low expected CTR, overly broad keywords, disorganized ad groups, and new keywords with little data.
Each cause negatively affects one or more Quality Score components: expected CTR, ad relevance, or landing page experience. Use the list below as a diagnostic map. Identify the weak component first, then match it to the likely structural cause. This approach prevents random optimization and keeps changes aligned with a clear hypothesis.
1. Low ad relevance (keyword-to-ad mismatch)
Low ad relevance happens when your ad does not closely match the keyword intent.
For example, a search for “red leather boots” paired with an ad headline such as “Winter Shoes Sale” creates a relevance gap. Google compares keyword themes with ad headlines and descriptions. Generic or loosely aligned copy often results in a “Below average” ad relevance rating. Lower ad relevance reduces Quality Score and may increase CPC.
Solution: restructure ad groups into tighter keyword themes and rewrite ad copy to mirror the primary search term.
2. Poor landing page experience
Poor landing page experience arises when the destination page lacks relevance, clarity, or usability.
Sending users to a generic homepage instead of a product-specific page weakens intent alignment. Slow load times, thin content, unclear offers, or complicated navigation reduce trust and engagement. A weak landing page can lower Quality Score even if ad relevance and CTR are strong.
Solution: align page content with keyword intent, improve speed and mobile usability, and remove friction in forms and calls to action.
Give every ad the page it deserves – fast, focused, mobile-ready.
3. Low expected click-through rate (CTR)
Low expected CTR means Google predicts fewer clicks than competing ads.
Expected CTR is based on historical data and auction signals. If your ads rarely get clicked, your predicted CTR drops. Boring headlines and weak value propositions lower engagement. Irrelevant keywords also reduce CTR.
Solution: improve headline specificity, test stronger offers, and refine keyword-to-ad alignment.
4. Too broad or irrelevant keywords
Overly broad or irrelevant keywords trigger impressions for searches that do not match the offer.
Broad match terms can attract low-intent traffic. Users see your ad but do not click. This hurts expected CTR and ad relevance. Low-quality traffic also wastes budget. Poor alignment at this level shows how strongly keywords affect overall ad quality and auction competitiveness.
Solution: refine match types, add negative keywords, and eliminate irrelevant traffic sources.
5. Disorganized ad groups
Disorganized ad groups mix unrelated keywords under one set of ads. This makes it hard to write highly relevant ads.
When multiple intents share one ad group, ad copy cannot match every query precisely. This weakens ad relevance and often results in “Average” or “Below average” ratings. Campaign structure directly influences Quality Score.
Solution: create smaller, tightly themed ad groups with aligned keyword clusters.
Structure your campaigns. Scale your pages. Design dedicated landing pages for every intent.
6. New keywords (no data)
New keywords often display unstable or low Quality Scores due to limited historical data.
Expected CTR relies on historical signals. Historical performance data plays a major role in how Google predicts CTR and evaluates quality. Without data, Google cannot accurately predict CTR. This is normal and temporary. As impressions and clicks grow, ratings stabilize.
Solution: allow new keywords to gather sufficient data before making major structural changes.
3 Ways to Improve Google Ads Quality Score
Three ways to improve Google Ads Quality Score are improving expected CTR, improving ad relevance, and improving landing page experience. Each action targets one of the three Quality Score components.
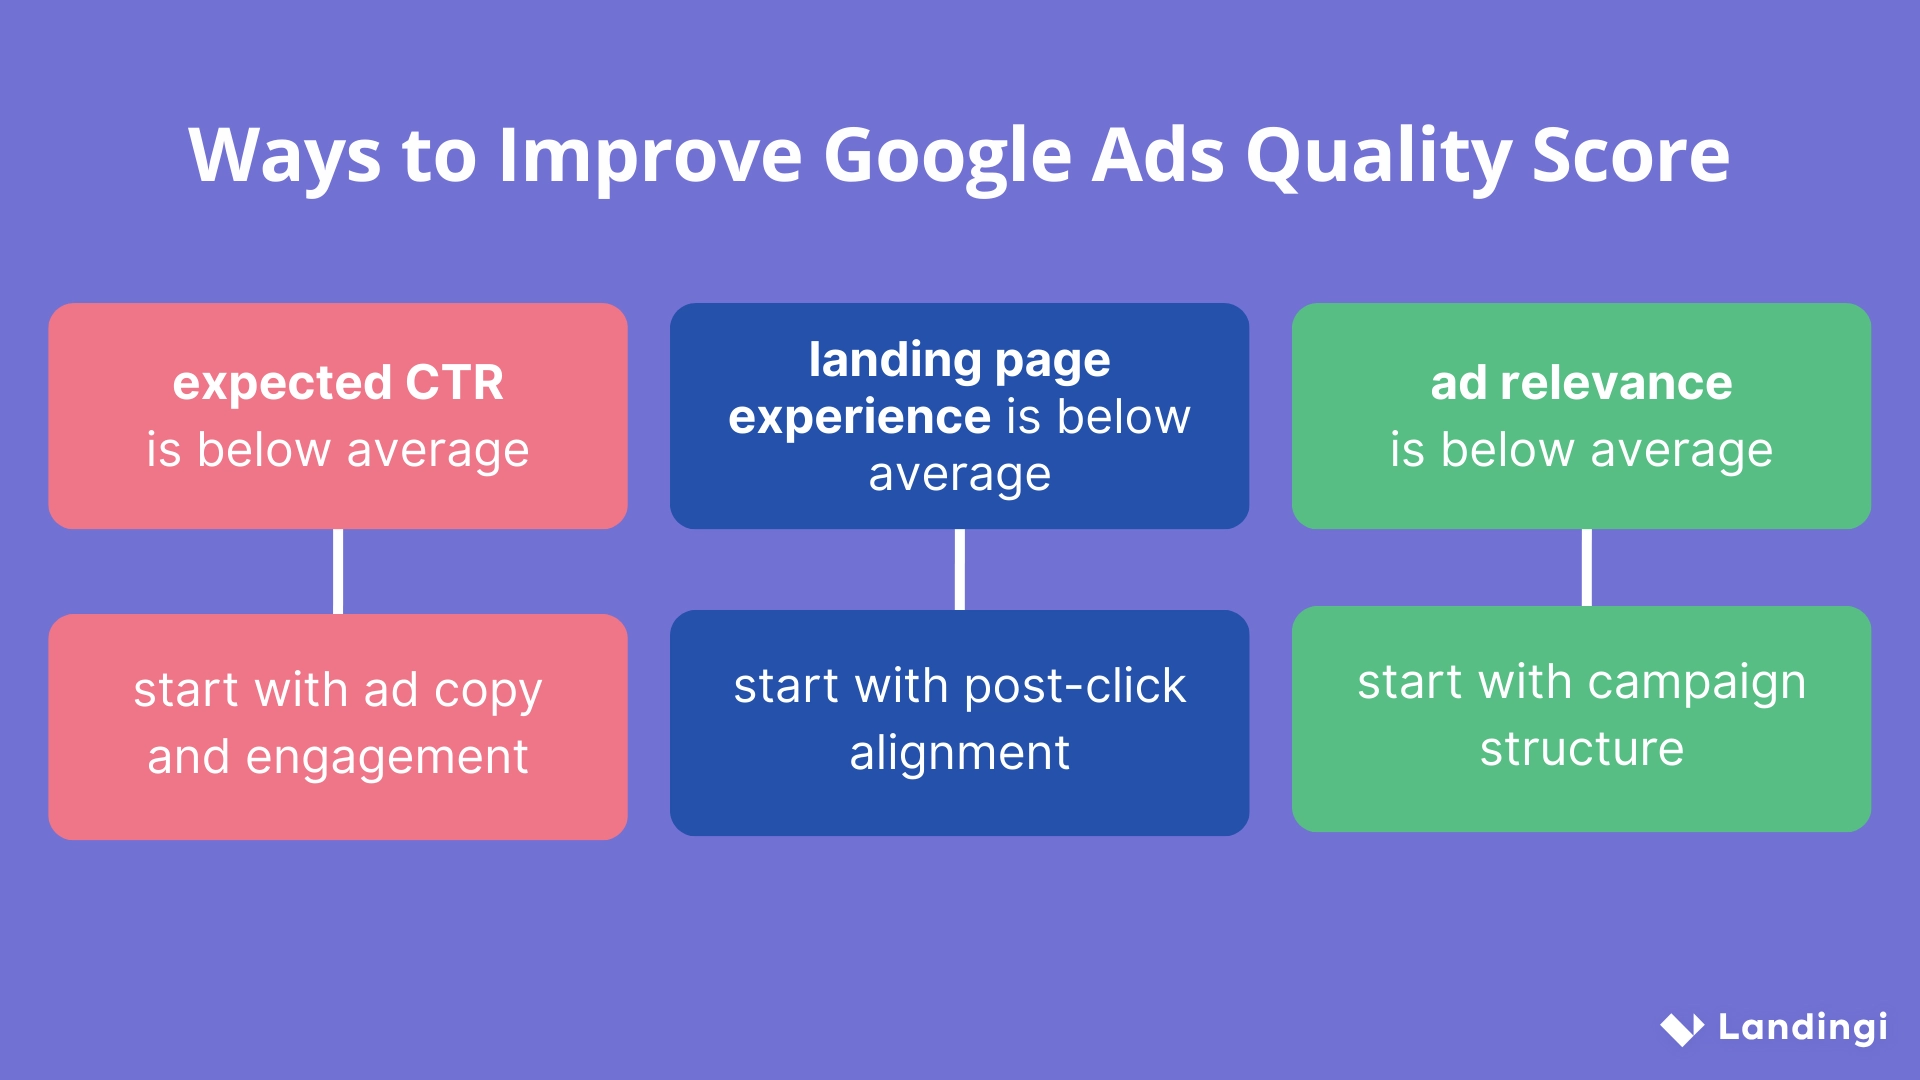
Quality Score improvement requires structural alignment rather than cosmetic edits. Select the optimization lever based on the weakest component:
- If expected CTR is below average, start with ad copy and engagement.
- If ad relevance is below average, start with campaign structure.
- If landing page experience is below average, start with post-click alignment.
1. Improve expected click-through rate (CTR)
Improve the expected CTR by writing stronger headlines, highlighting benefits, and testing variations.
Include the main keyword in your headline. Use clear offers like “Free Delivery” or “24-Hour Quote.”
Add urgency when relevant. Test multiple ad variations within each ad group. Pause ads with low CTR over time. Pausing ads or keywords doesn’t affect Quality Score because it is based on how well your keywords and ads perform.
Higher engagement sends positive signals to Google.
2. Improve ad relevance
Improve ad relevance by tightly grouping keywords and aligning ad copy with search intent.
Create small ad groups focused on one theme. Write ads that directly reflect the keyword. If the keyword is “CRM for real estate,” say it in the headline.
Avoid broad, generic messaging. Use negative keywords to remove mismatched searches and filter irrelevant search terms before they trigger your ads.
When ad copy reflects keyword intent precisely, both ad relevance and expected CTR improve. Structural alignment between keywords, ads, and landing pages strengthens overall ad quality and competitiveness.
3. Improve landing page experience
Improve the landing page experience by matching page content to the keyword and making the page easy to use.
The headline should repeat the main keyword theme. The offer should match the ad promise.
Keep forms simple and visible. Make the page fast and mobile-friendly. Provide clear contact details and trust signals.
Landing page alignment reduces friction after the click. Strong landing page experience supports both conversion rate and Quality Score improvement.
Boost your Quality Score the smart way! Design faster, clearer, high-performing landing pages.
Quality Score Myths vs Facts
Quality Score misconceptions often lead to inefficient optimization decisions. Official guidance from Google Ads Help clarifies how Quality Score functions in practice.
Many advertisers treat Quality Score as the main goal of optimization. Google explains that Quality Score is a diagnostic tool, not a KPI.
Another common myth is that the visible 1–10 score directly enters the auction. Google states that this number is not used in real-time auctions.
There is also a belief that one landing page can support all ad groups. In reality, landing page experience is evaluated at the keyword level.
| Myth | Fact |
|---|---|
| “You should optimize campaigns to increase Quality Score as the main goal.” | Quality Score is a diagnostic tool and should not be treated as a KPI. |
| “The 1–10 Quality Score directly affects auction results.” | The visible 1–10 score is not used in real-time auction calculations. |
| “One landing page works for all ad groups.” | Landing page experience is evaluated based on relevance to each keyword. |
The correct approach is practical:
Use Quality Score to identify structural weaknesses. Optimize campaigns for conversions, CPA, and ROAS. Allow Quality Score to improve as a consequence of better alignment and performance.
Quality Score in Different Campaign Types
Quality Score applies to search network campaign types at the keyword level. You can see it only for Search campaigns. Campaign types such as display network, Video, and Performance Max do not display the same 1–10 Quality Score. These campaign types rely on different quality diagnostics and auction-time signals.
When reviewing reports, do not look for the keyword-level Quality Score in campaign types where it does not exist. For Performance Max and Display campaigns, focus on native performance diagnostics, audience signals, asset strength indicators, and landing page relevance rather than the 1–10 Quality Score metric.
Understanding this distinction prevents incorrect performance analysis across campaign types.
Your campaigns deserve better pages. Build, test, and scale with Landingi.
What’s the Use of Landing Pages in Improving Quality Score?
Landing pages influence Quality Score by strengthening landing page experience, one of its three core components alongside expected CTR and ad relevance.
Google evaluates how relevant and useful your page is after a user clicks an ad. A landing page that matches the keyword theme and ad message improves landing page experience ratings. A generic or misaligned page weakens relevance and lowers diagnostic scores.
Dedicated landing pages for tightly themed ad groups increase alignment between:
- Keyword intent
- Ad messaging
- Post-click content

Strong alignment improves landing page experience and often increases conversion rate. Conversion improvements reinforce long-term campaign performance.
Specialized landing page platforms such as Landingi simplify the creation of theme-specific landing pages. Features such as Smart Sections, dynamic text replacement, subaccount management, and Programmatic Landing Pages allow scalable alignment across multiple keyword groups.
Let Landingi’s AI insights guide your conversions – build smarter from the first click.
Create Landing Pages that Support Higher Quality Score
Quality Score is a diagnostic tool that helps identify weaknesses in expected CTR, ad relevance, and landing page experience. It should guide your optimization efforts, not replace core KPIs like CPA or ROAS. The three components work together and must stay aligned.
Status labels such as “Above average” or “Below average” show how your ads compare with competitors. Use them as action signals. If expected CTR is low, improve your copy. If ad relevance is weak, restructure ad groups. If landing page experience is below average, refine your page.
Landing pages often produce the largest performance gains because landing pages connect search intent, ad message, and final offer. With Landingi builder, you can quickly duplicate pages, use Smart Sections, apply dynamic text replacement, manage subaccounts, and build Programmatic Landing Pages for each ad group. This structure improves landing page experience and helps raise conversion rate at the same time. Because Quality Score affects both visibility and costs, better alignment directly supports long-term profitability.
Audit your lowest-scoring, highest-spend keyword themes and ensure each has aligned ad copy and a dedicated landing page variant. If you want to speed up page creation and testing for each theme, Landingi can help you duplicate and optimize landing pages faster. Try Landingi now for free.