In Landingi, you have access to basic statistics of your landing page and account traffic.
You can track the number of visits, leads, conversion rate, and sales closed via payment gateways (read more here: Stripe, PayPal, and PayU). You can also track leads and unique visits on a chart.
Stat system in Landingi is based on the ls_sid cookie – it is responsible for every unique visit and is valid for 30 minutes. For tracking visits on landing pages, we use first-party cookies, which means that cookies are set by the exact site you visit.
What are the advantages of first-party cookies?
- First-party cookies are only saved by the website you visit – no other site can access them, which makes your data more secured.
- Browsers do not block first-party cookies (unlike third-party cookies).
- First-party cookies have fewer privacy restrictions – they do not require user consent.
- Some countries and local laws do not allow the use of third-party cookies at all without the explicit consent of the visitor.
Track unique visits with Traffic History
You can track unique visits for all of your landing pages (per account).
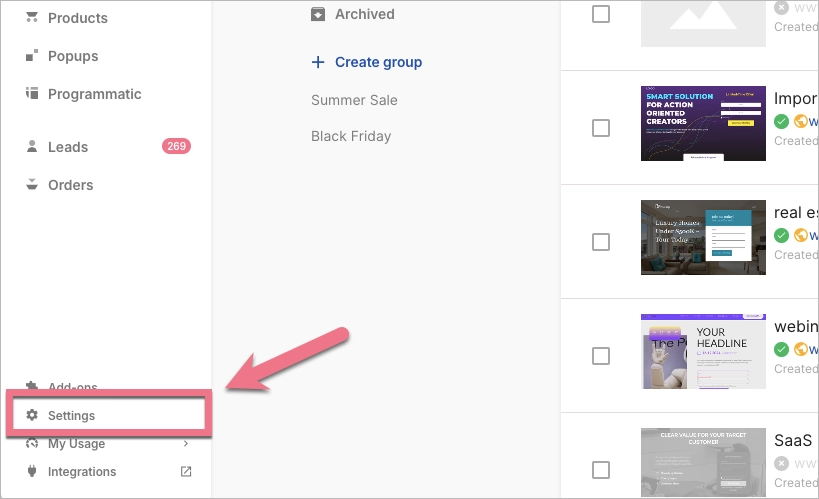
1. Access the Settings tab located in the lower left corner.
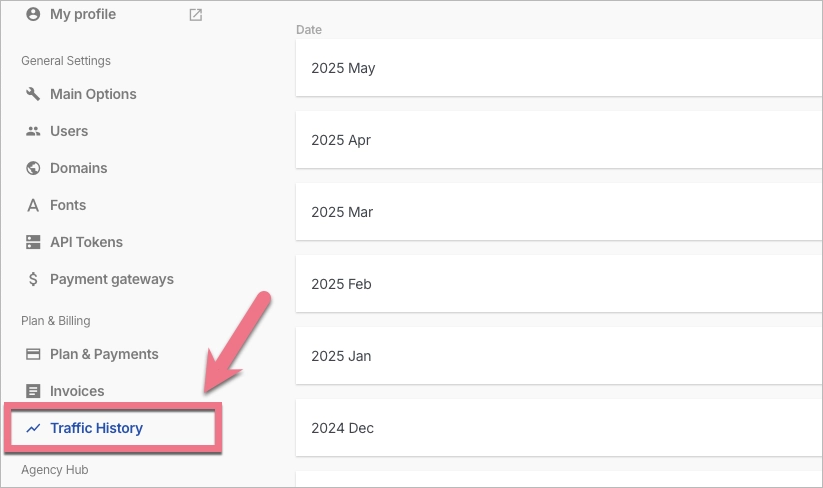
In the Traffic History tab, you’ll see the number of unique visits for each month.
Track statistics for each landing page
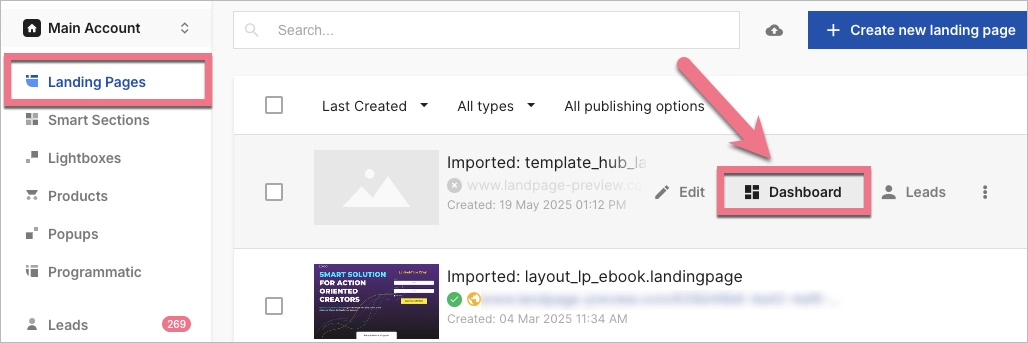
1. Go to the Landing Pages tab and navigate to the Dashboard of your landing page.
2. In the Overview tab, you’ll see the statistic panel with visits, conversions, and conversion rate.
The Page performance chart tracks the number of conversions and visits for the last 30 days by default. You can adjust the time range by yourself.

3. By default, conversions equal leads, but you can change the conversion goal to sales. With EventTracker activated, you can also set it to events.
TIP: The landing page’s conversion is based on form submission. If your landing page doesn’t contain a form, you can track button clicks as conversion.

You can select an event as a conversion when you enable EventTracker. It gives you access to advanced stats. You can also use additional statistical systems such as Google Analytics.

4. Below the Page performance chart, you can find data about scroll depth and top events (if EventTracker is enabled). In top events, you can select an event to count as a conversion.

Events tab
The Events tab is where all information collected by EventTracker is displayed.

Below the basic chart, you can find the All events list. Click a three-dot icon to access more options for an event.


